

Smart Money Concepts
Smart Money Concepts (SMC) is a way of reading a chart that looks for the footprints of very large traders. A big buyer cannot fill a huge order in one go, so the attempt leaves marks in the price: gaps a fast move skipped, the last candle before a strong push, and spikes just past an obvious high or low. The SM chip finds 37 of these marks on your own candles and draws them, each in its own colour.
What this page is
The SM chip opens one panel with three settings at the top and 37 rows below, split into two groups: Structure (read from the swing highs and lows) and Candle (read from the shape of the candles). Every row is one button.
Every row draws two kinds of the same mark: still valid, and already used up. They share one colour, so you can tell at a glance which mark it is and whether it still counts.
All the work is done in your browser on the candles you are looking at, on any timeframe. Nothing waits for the server.
Some ideas appear in both groups on purpose — order blocks and liquidity. The Structure version uses a stricter rule; the Candle version a looser one. Seeing both on one chart shows you the difference.
Why it helps you
- Order blocks and fair value gaps are the two to learn first, because both give you a price area to watch rather than one line. A return to an area is a place to watch for a reaction, not a signal by itself.
- Liquidity Pools and Sweep show where stop orders probably sit. A quick run past an obvious low that closes back above it often comes before a move up.
- CHoCH fires early and is often wrong. Treat it as a reason to pay attention, and wait for a BOS in the new direction.
- A bearish reading (a CHoCH down, price in PREMIUM, a supply block above) means protect your profit or wait. NEPSE has no short selling, so it is never a reason to sell what you do not own.
- Most SMC marks are short-term. The useful ones for a long holder are Premium / Disc. and order blocks on a weekly chart.
- Premium / Disc. on the weekly chart tells you plainly whether you are being asked to buy in the expensive half or the cheap half of the last big move.
- An order block on a weekly chart marks where serious buying last happened. That is a good price area to note before you add to a holding.
When to use it, and where to find it
- Before you buy, to see whether your price sits on an open gap or an order block, or on nothing at all.
- After a sharp move, to find the gap it left. Price often comes back to fill it.
- On a daily chart after the close, when the last candle is final. During the session, a mark that depends on the last candle can still change.
Try it — a short walkthrough
- 1Open SM and switch everything offClick the SM chip. Click any lit row to switch it off, so you start from a clean chart.
- 2Draw the swingsClick Structure H/L. Check the HH, HL, LH and LL labels against the turns you see. If there are too many, raise Depth to 3 or 4.
- 3Add the breaksClick BOS and CHoCH. The newest one tells you whether the trend just continued (BOS) or may be turning (CHoCH).
- 4Add one area markScroll to the Candle group and click FVG. Clear amber boxes are open gaps; faint ones are already filled.
- 5Keep the chart readableLower Back count to 2 or 3 if the chart is crowded. Switch rows off when you move to the next idea.
The panel and the chart, part by part
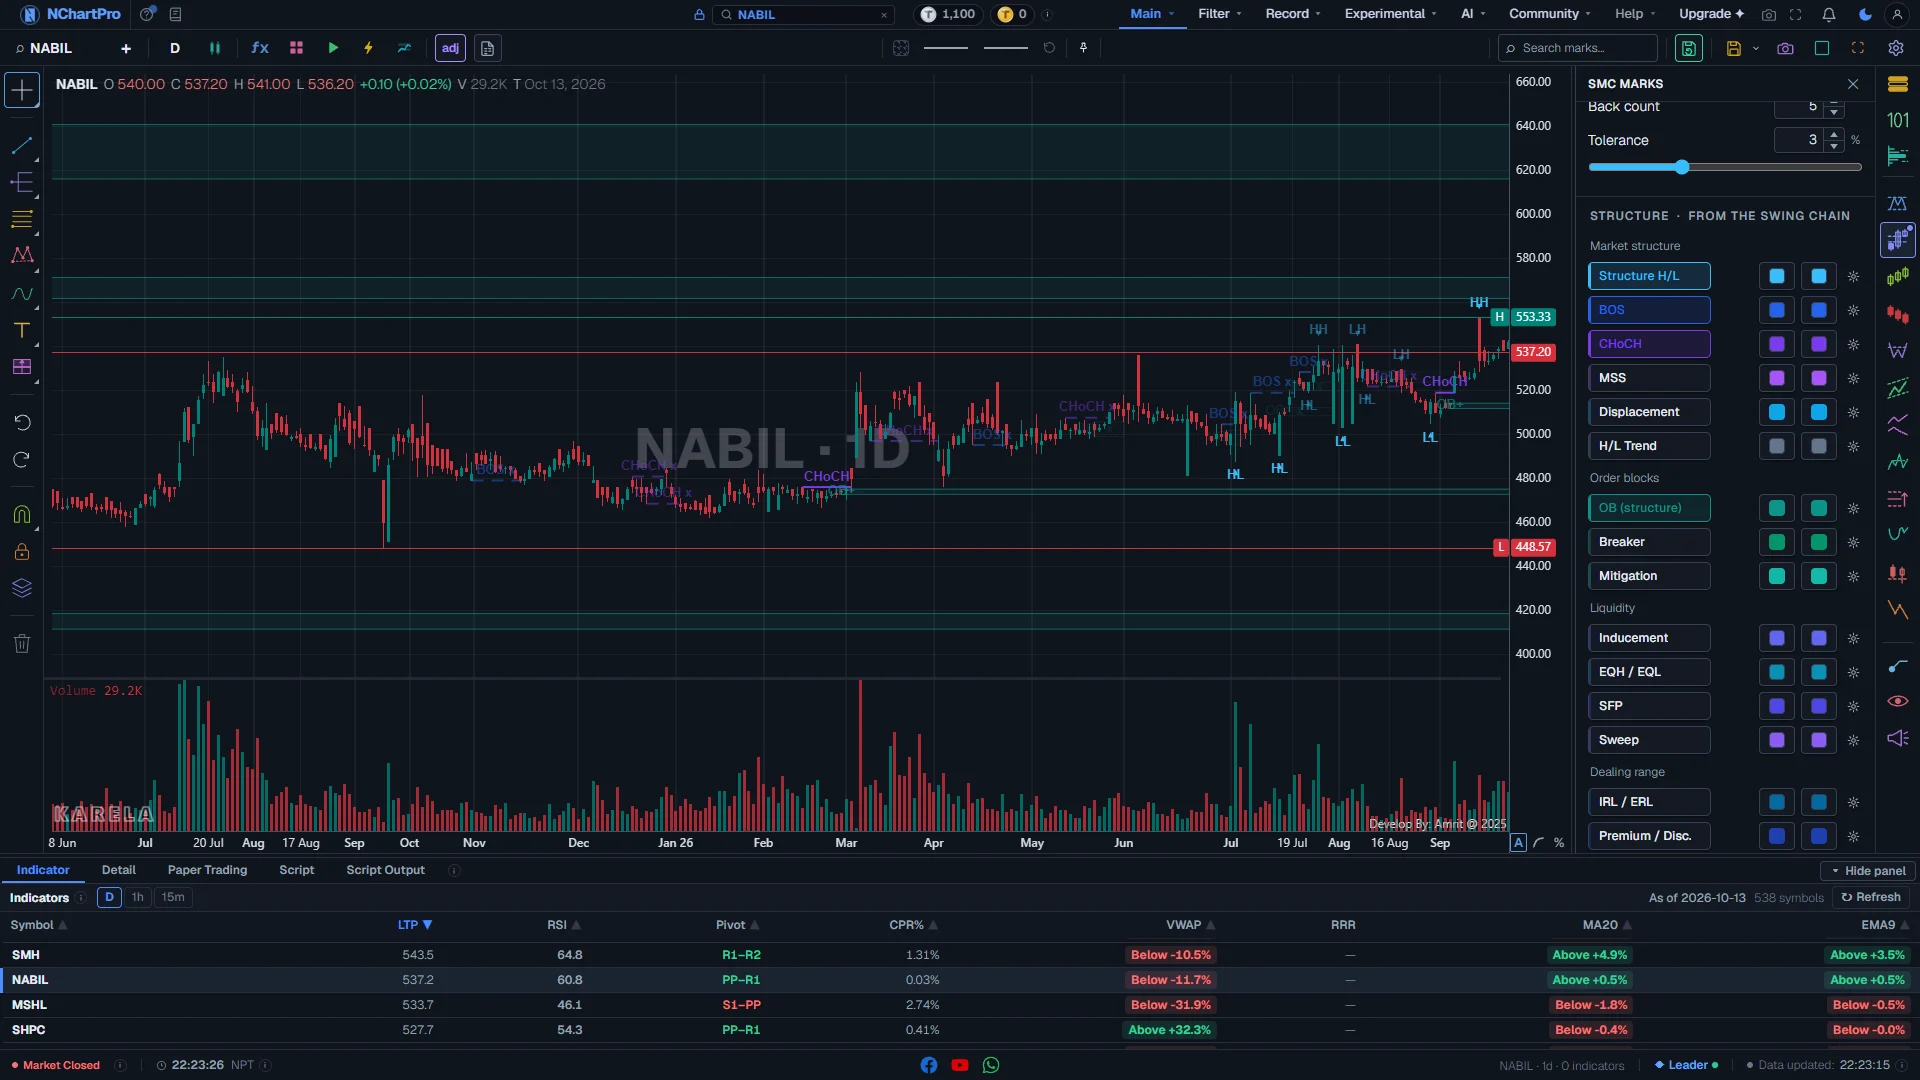
The SM panel open on a daily chart, with four Structure marks switched on. Each part with a close-up of the real screen; the numbers match the dots on the picture.
SMC Marks
The SM chip on the right rail opens this panel. One panel holds all 37 marks, in two groups.
How — Click the SM chip to open it; click it again, press Escape or click the cross to close it. Drag the panel's left edge to make it wider.
- A small dot on the SM chip means at least one SMC mark is switched on, even while the panel is closed.
- Marks stay on the chart after you close the panel. Switch them off here to remove them.
Depth, Back count, Tolerance
Three settings at the top. They change many rows at once, not one group.
How — Type a number or use the arrows. Hover a setting to see how many of the 37 rows it reaches.
- Depth (2 to 30, starts at 2): how many bars on each side a high or low must beat to count as a swing. Higher means fewer, bigger swings. Only rows built on swings use it.
- Back count (1 to 40, starts at 5): how many of the newest marks each row draws. It only limits the drawing, so every row responds to it.
- Tolerance (0.5 % to 8 %, starts at 3 %): how loose a shape test is — for example how close two highs must be to count as equal. Only some rows read it.
Structure group
Marks read from the chain of swing highs and lows. Their colours are cool: blues, greens and violets.
How — Each row is a button. Click it to draw that mark; click again to remove it. The two colour boxes beside it and the gear set how it looks.
- Market structure: Structure H/L, BOS, CHoCH, MSS, Displacement, H/L Trend.
- Order blocks: OB (structure), Breaker, Mitigation.
- Liquidity: Inducement, EQH / EQL, SFP, Sweep.
- Dealing range: IRL / ERL, Premium / Disc., OTE, Fib Retrace.
- Models: PO3 / AMD, Judas Swing (intraday charts only), Turtle Soup.
- Volume: Swing High-Vol (POC) — the busiest price inside each swing, with its own Depth box (2 to 20, starts at 15).
Structure H/L — the swing labels
Every confirmed swing, named by how it compares with the swing before it. Sky blue.
How — Switch it on first. Every other Structure mark is built from these swings, so check they match the turns you see by eye. If there are too many, raise Depth.
- HH (higher high) and HL (higher low): the stock is making an uptrend.
- LH (lower high) and LL (lower low): the stock is making a downtrend.
- Each swing is marked with a small arrow and its label.
BOS, CHoCH, MSS — the breaks
A close past an earlier swing. BOS is blue, CHoCH violet, MSS purple.
How — Turn on BOS and CHoCH together. Read the latest one: it tells you whether the trend just continued or just changed.
- BOS (Break of Structure): price closed past the last swing in the SAME direction as the trend. The trend continues.
- CHoCH (Change of Character): the first close past a swing the OTHER way. The earliest hint the trend may turn. It is often wrong, so wait for a BOS in the new direction.
- MSS (Market Structure Shift): a CHoCH with a strong candle and a gap behind it. Stronger than a plain CHoCH.
- A bearish CHoCH in an uptrend is a reason to protect profit or stay out. NEPSE has no short selling.
Order blocks
Price boxes where large orders are thought to sit. Teal and green boxes.
How — Use them as areas to watch. When price comes back into a box, look at how it reacts before doing anything.
- OB (structure) — teal box, label OB+ (buyers) or OB- (sellers): the last opposite-colour candle before a move that broke structure.
- Breaker — green box, label BB: an order block that failed. Price went through it and turned, so it now works from the other side.
- Mitigation — light teal box, label MB: a block that failed without a stop hunt first. Price often comes back to it.
Dealing range
The range price is working inside now, and where in that range it sits. Deep blues and indigo.
How — Look at Premium / Disc. before you buy. Buying in the lower half of the range costs less than buying in the upper half.
- IRL / ERL: the range's top (ERL H), bottom (ERL L) and middle line (EQ).
- Premium / Disc.: the upper half is labelled PREMIUM (expensive), the lower half DISCOUNT (cheap). It says where price is, not which way it will go.
- OTE (Optimal Trade Entry): the 61.8 % to 79 % pullback of the last move.
- Fib Retrace (slate grey lines): 23.6, 38.2, 50, 61.8 and 78.6 % of the newest move only.
What is drawn on the chart
Each mark is drawn at the exact prices and bars where it formed, in its row's colour, with a short label.
How — Zoom in to read the labels. If the chart is crowded, lower Back count or switch rows off.
- Solid line or clear box with a plain label: VALID — the mark is still in force at the last candle (the gap is not filled, the block is not used up, the level is not broken).
- Dashed, paler line, or a very faint box, and a label ending in " x" (for example "BOS x"): INVALID — the mark is used up or broken. It is kept as history.
- Boxes are a light wash (about 10 %) with an outline, so the candles stay visible.
- The first colour box beside a row sets the valid colour; the second sets the invalid colour. The gear opens the line style, label size and that mark's own inputs.
Every part, up close
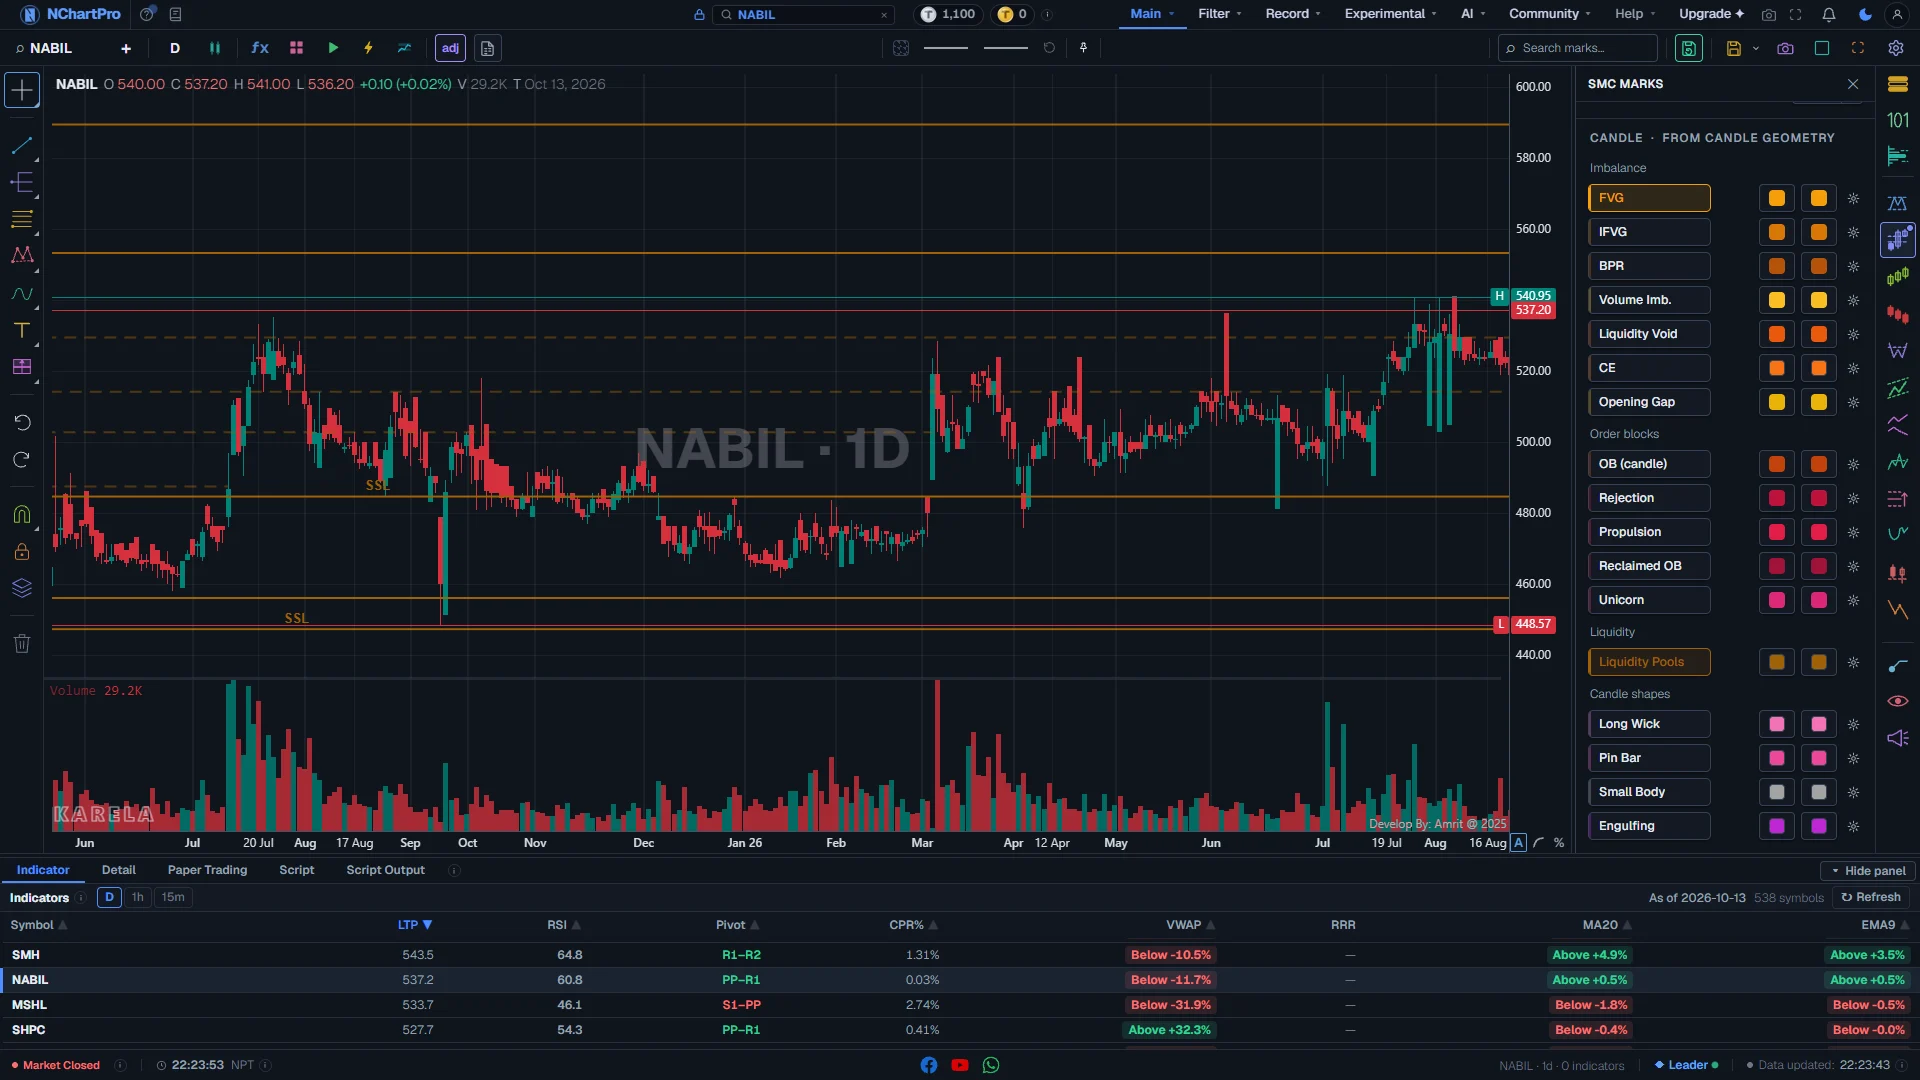
The SM panel scrolled to the Candle group, with FVG and Liquidity Pools switched on. Each part with a close-up of the real screen; the numbers match the dots on the picture.
Candle group
Marks read from the shape of the candles alone, with no swing chain. Their colours are warm: ambers, oranges and pinks.
How — Use one or two rows at a time. A warm colour on the chart always comes from this group; a cool colour from the Structure group.
- Imbalance: FVG, IFVG, BPR, Volume Imb., Liquidity Void, CE, Opening Gap.
- Order blocks: OB (candle), Rejection, Propulsion, Reclaimed OB, Unicorn.
- Liquidity: Liquidity Pools.
- Candle shapes: Long Wick, Pin Bar, Small Body, Engulfing.
FVG and the gap family
Price ranges a fast move skipped, where little trading happened. Amber and orange boxes.
How — Switch on FVG first. An open (valid) gap is a price area that price often comes back to.
- FVG — amber box: three candles where the first and third do not overlap. Used up once price trades to the far edge of the gap.
- IFVG — darker amber: a gap price closed right through. It now works from the other side.
- BPR: where an up gap and a down gap overlap. VI (Volume Imb.): a gap between candle bodies only. LV (Liquidity Void): a run of one-way candles.
- CE — orange line: the exact middle (50 %) of a gap. GAP — yellow box: the space between one bar's close and the next bar's open.
Order blocks from candles
The same idea as the Structure order blocks, with a looser rule. Burnt orange, red and pink boxes.
How — Compare OB (candle) with OB (structure) on one chart. Where both draw a box, the area is stronger.
- OB (candle) — burnt orange, label OB+ or OB-: the last opposite candle before a strong move. Expect many more boxes than the structure rule.
- Rejection (RB): the wick of a candle at a turn — the part of the bar the market refused.
- Propulsion (PB): a block that formed on top of an earlier one. Reclaimed OB (ROB): price closed through a block and then back inside it.
- Unicorn (UNI): a breaker block with a fair value gap on top of it. It should be rare.
Liquidity Pools
Many swings that stopped at about the same price. Stop orders are likely resting there. Dark gold lines.
How — Watch what price does when it reaches a pool: run through and come back (a stop hunt), or run through and stay (a real break).
- BSL (buy-side liquidity): a pool above the price.
- SSL (sell-side liquidity): a pool below the price.
- A pool that price has already taken is drawn dashed with " x".
Candle shapes
Single candles worth noticing. Pink, magenta and grey arrows with a label.
How — Read them as a small extra clue next to a box or a level, never alone.
- For these four rows, VALID means CONFIRMED: the next few bars moved the way the candle suggested.
- WICK (Long Wick): a long tail — price was pushed back from a level. PIN (Pin Bar): a tiny body at the end of a long tail.
- SB (Small Body): open and close almost equal, a pause. ENG (Engulfing): one body covers the whole body before it, in the other colour.
Gaps and pools on the chart
Open gaps are clear amber boxes; filled gaps are faint. Pools are gold lines with BSL or SSL.
How — Look for an open gap or a pool close to today's price. Those are the levels most likely to matter soon.
Reading the numbers
- Swing: a high or low that is higher (or lower) than the bars on both sides. Depth sets how many bars.
- Valid / invalid: valid means still in force at the last candle; invalid (dashed or faint, label ending " x") means used up. For the four candle shapes, valid means confirmed by the bars that followed.
- Order block (OB): the last opposite-colour candle before a strong move. OB+ is a buying block, OB- a selling block.
- Fair value gap (FVG): a price range a fast move skipped, between candle 1 and candle 3.
- Liquidity: stop orders resting just above old highs (BSL) or below old lows (SSL).
- Premium / discount: the upper and lower halves of the current range.
What it does not do
- SMC is a way of reading, not a measurement. Two traders will mark different order blocks; the panel follows one fixed set of rules.
- A mark is not a price target. A gap can stay open for years, and price can run straight through an order block.
- The SM chip is gated by your plan. If you cannot see it on the rail, your plan does not include it.
- Judas Swing only works on intraday charts. On a daily chart it draws nothing.
- These are readings of past candles, not advice to buy or sell.
Questions people ask
A clear box is still valid — the gap is open or the block has not been used. A faint box, or a dashed line with " x" on its label, is used up and kept only as history.
They use different rules. OB (structure) needs the move to break a swing; OB (candle) only needs a strong move. The candle one draws many more boxes. Where both agree, the area is stronger.
Usually not. Some marks are rare (Unicorn, MSS, Turtle Soup), and Judas Swing only works on intraday charts. Try a longer history, lower Depth, or raise Tolerance a little.
A pool is the level where stops are resting. A sweep is the moment price runs past that level, takes the stops and comes straight back. After a sweep of a low, price often turns up.