

Chart Patterns
Look at a chart from far away and the candles start to make shapes: a head with two shoulders, two equal tops, a triangle getting narrower, a small flag after a sharp rise. Traders have named these shapes. The CP chip finds 23 of them in your chart and shades each one over the candles that made it.
What this page is
The CP chip draws the big shapes that form over many candles. It is different from the CN chip, which names the shape of one to three candles. Both read the same chart at a different scale.
The detector looks for the swings in the price first, at many swing sizes, and then tests each group of swings against the rule for each shape. A shape is drawn when price confirms it by closing through its line. A shape that later fails is still drawn, with BUST on it.
Only the candles loaded on the chart are searched. Scroll left to load older history if you are looking for an older shape.
Why it helps you
- Flags and pennants matter most for short trades. They form inside a strong move and, if the move goes on, it often goes on fast.
- Triangles tell you a decision is coming, not which way. Plan for both: where you would buy on a break up, and where you would exit on a break down.
- Keep two or three shapes on at most. Twenty-three shapes on one chart is a drawing, not an analysis.
- On a weekly chart these shapes take months to form. A finished double bottom or inverse head and shoulders on a weekly chart is worth a look before buying.
- Flags and pennants last days. They do not mean much for a long holder.
- A shape tells you what already happened. A double bottom says buyers defended a price twice; it does not say they will a third time.
When to use it, and where to find it
- On the daily or weekly chart, when you want to see the last few months of a stock at a glance.
- When price has gone sideways for a while and you think it is coiling. Switch on the three triangles.
- After a big move, to see if the pause after it is a flag or the start of a turn.
Try it — a short walkthrough
- 1Set the chart to 1 day firstThese shapes take weeks to form. On a 5-minute chart you mostly find noise.
- 2Open CP and switch on one shapeClick the CP chip and click Double Bottom. Any double bottoms are shaded on the chart, with P on the peak between the two bottoms and BRK at the break. If nothing appears, there is none in the loaded candles.
- 3Add the trianglesClick Ascending, Descending and Symmetric Triangle. One stretch of candles never gets two of these names, so they do not draw on top of each other.
- 4Check the label at the endFind BRK on a shape. If BUST appears after it, the break failed.
- 5Switch shapes off before changing stockClick each row again. Shapes you leave on carry over to the next stock.
The panel and the chart, part by part
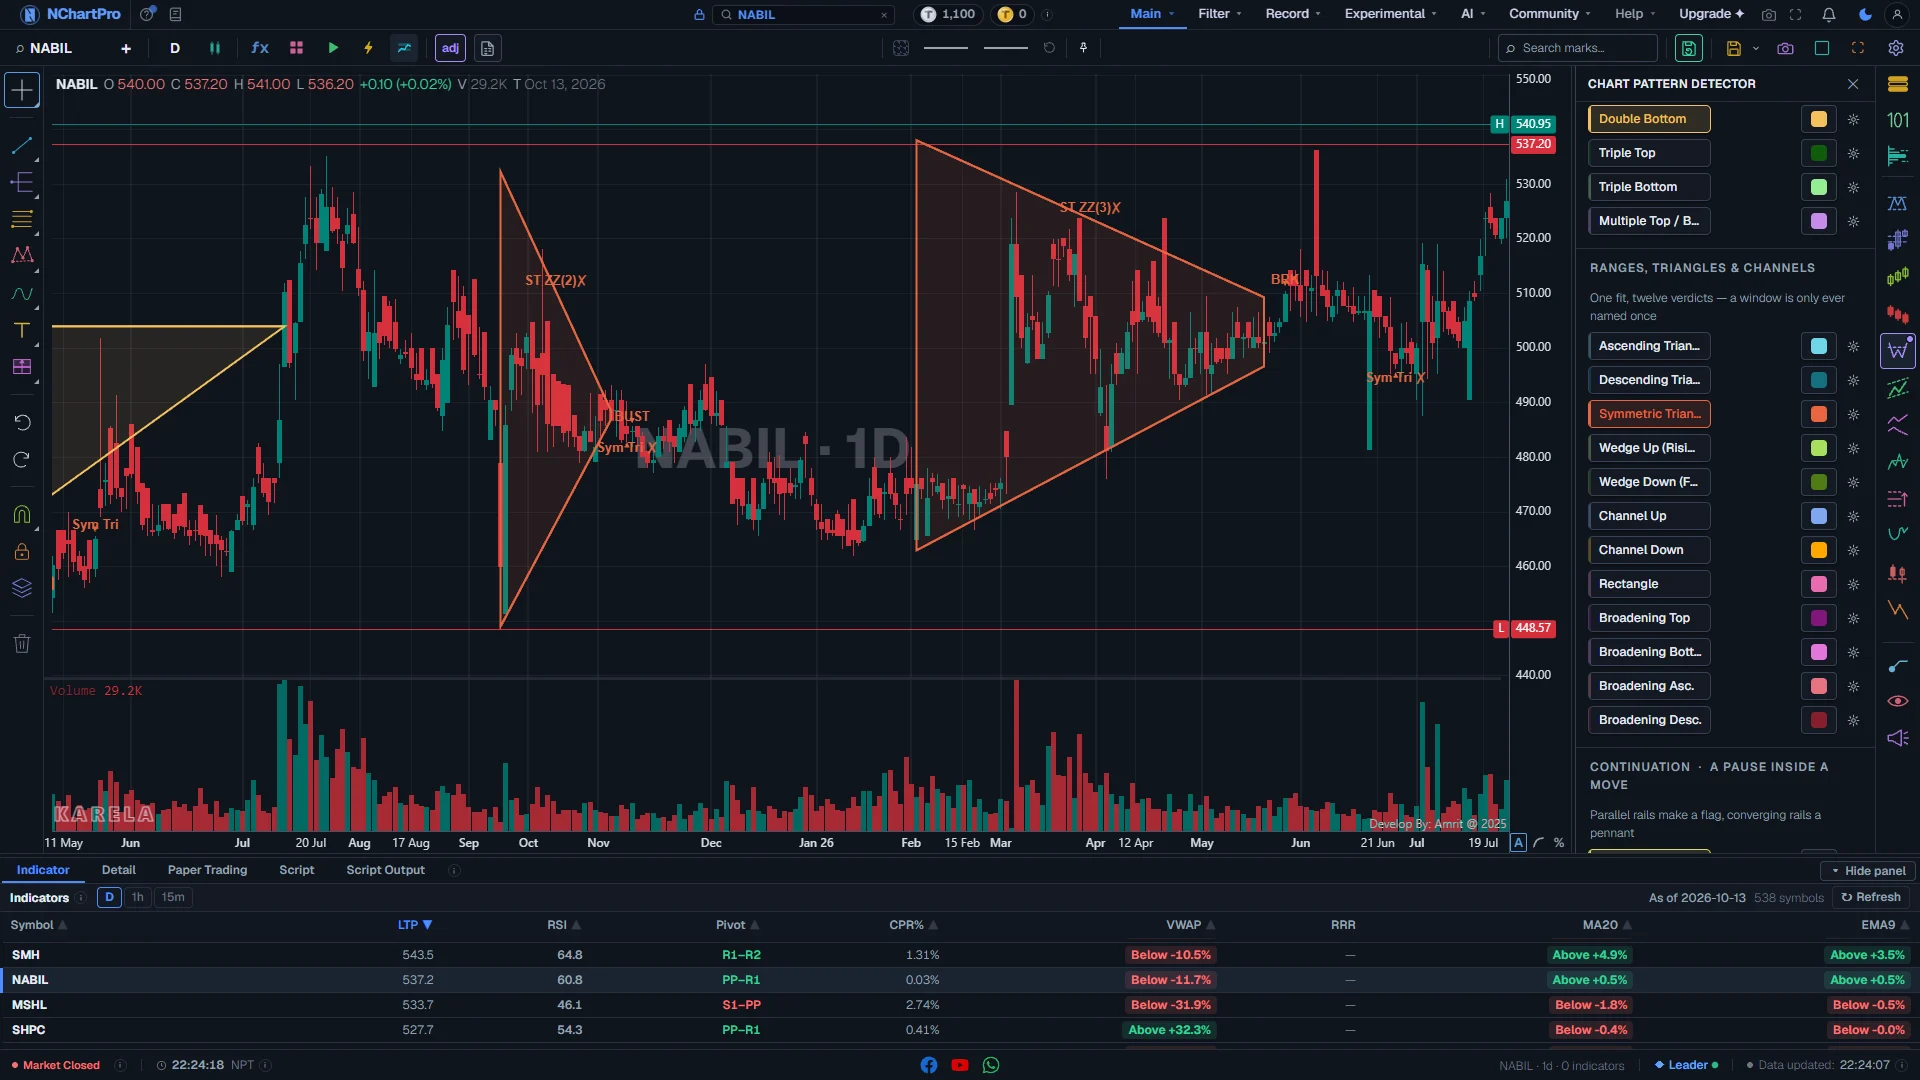
Chart Pattern Detector (CP) open on a daily chart, with a few shapes switched on. Each part with a close-up of the real screen; the numbers match the dots on the picture.
Chart Pattern Detector
Opens from the CP chip in the right-hand mark column. Three groups, 23 rows, no number boxes.
How — Click CP to open it; click it again, the ✕, or press Escape to close. Shapes you switched on stay on the chart.
- There is no Depth or Tolerance box here on purpose. The search is set to its widest (depth 2) and two tops count as equal when they are within about 2 %.
- Each shape is drawn at most 40 times, newest first.
Reversals
Seven shapes where a move stopped and turned.
How — Use these at the end of a long rise or fall. A shape only counts once price closes through its neckline.
- Head & Shoulders: three peaks, the middle one highest. Confirmed when price closes down through the neckline under them. A top.
- Inverse H&S: the same upside down. Confirmed when price closes up through the neckline. A bottom.
- Double Top / Double Bottom: two tops (or bottoms) at about the same price, with a real pullback between them.
- Triple Top / Triple Bottom: exactly three touches of the same price.
- Multiple Top / Bottom: four or more touches. Rare — on most stocks it draws nothing.
One row
Each row is one shape, in its own colour. The colour box and the gear set how it is drawn.
How — Click the name to switch it on or off. Click the colour box to change colour, shade, line and labels. The gear (⚙) opens that shape's own inputs and its style in one box. Hover the name to read the rule.
- On: the button fills with its colour. Off: grey with a thin coloured line at its left edge.
- In a pair, the light shade is the side whose NAME says up (Double Bottom, Wedge Up, Bull Flag) and the dark shade the side whose name says down. It is about the name, not the forecast — a rising wedge often breaks down.
Ranges, triangles & channels
Twelve shapes from one test: two lines are fitted to the highs and the lows, and their slopes decide the name.
How — Switch on several at once if you like — one stretch of candles is only ever given one of these twelve names.
- Ascending Triangle: flat top, rising lows. Descending Triangle: flat bottom, falling highs. Symmetric Triangle: both lines closing in.
- Wedge Up / Wedge Down: both lines rising (or falling) and closing in. A rising wedge often breaks down; a falling wedge often breaks up.
- Channel Up / Channel Down: both lines rising (or falling) and parallel. Rectangle: both lines flat.
- Broadening Top / Bottom: lines spreading apart, like a megaphone, after a rise (top) or a fall (bottom). Broadening Asc. / Desc.: one line flat, the other spreading away.
Continuation
A short pause inside a strong move: a pole, then a rest.
How — Use these to join a move that has already started, not to guess a turn.
- Bull Flag: a sharp rise (the pole), then a small drift down between two parallel lines for 5 to 15 candles.
- Bear Flag: a sharp fall, then a small drift up. In NEPSE a bear flag is a reason to stay out, not to sell short.
- Bull / Bear Pennant: the same, but the two lines close in instead of running parallel.
What is drawn on the chart
A light shaded body over the candles of the shape, its lines, and small triangles with short labels at the key points — all in the row's colour.
How — Zoom in on a shape and check it with your own eyes. If it does not look like its name, trust your eyes.
- Shaded body: a soft wash of the row's colour over the whole shape.
- Thick lines: the neckline (labelled "Neckline") or the two rails of a triangle, wedge or channel.
- LS, H, RS: left shoulder, head, right shoulder. A1, A2: the two low points between them that the neckline joins.
- V or P: the valley between two tops, or the peak between two bottoms.
- Rail labels: AT, DT, ST (triangles), RW, FW (rising / falling wedge), CH (channel), RC (rectangle), BT, BB, BA, BD (broadening); ZZ(n) is the swing size it was found at.
- P and BF / BrF / BP / BrP: the start of the pole, and the bull flag, bear flag, bull pennant or bear pennant.
- BRK: the candle that closed through the line — the shape is confirmed there.
- BUST: after the break, price came back through the other side before moving 10 %. The shape failed.
- No target or stop lines are drawn.
Reading the numbers
- Neckline: the line a reversal shape must close through to be confirmed.
- Rail: one of the two lines fitted to the highs (upper rail) and the lows (lower rail).
- Pole: the sharp move before a flag or pennant.
- Break (BRK): the candle that closed through the line. Bust (BUST): the break failed.
- Swing size, ZZ(n): how big a swing had to be for this shape. Bigger n means a bigger, slower shape.
What it does not do
- The detector finds shapes that fit a rule. It does not score them, so a strong shape and a weak one look the same.
- There are no Depth or Tolerance boxes, so you cannot loosen or tighten the search. This is deliberate: looser settings drew shapes on almost every wiggle.
- No price target is drawn. A shape is a reading, not a forecast, and not advice.
- A shape near the newest candle can change while the market is open.
Questions people ask
Scale. CP finds shapes that take weeks — a triangle, a head and shoulders. CN names the shape of one, two or three candles.
Usually not. Both lines rise but they close in, so the rise is running out of room. It often breaks down. In NEPSE that is a reason to exit or stay out.
They moved. Flat price levels and higher-high / lower-low labels are on the SnR chip; sloping trendlines are on the Trend chip.
That is normal. Four touches of the same price within about 2 % is rare. Triple Top and Triple Bottom have their own rows.