

Divergence
A divergence is a disagreement. Price makes a new low, but the momentum line under the chart makes a higher low. Selling is still happening, but with less force each time. The DV chip finds these disagreements on your own candles and draws them: one arrow on the price, one arrow on the momentum line, and a short tag that says which kind it is.
What this page is
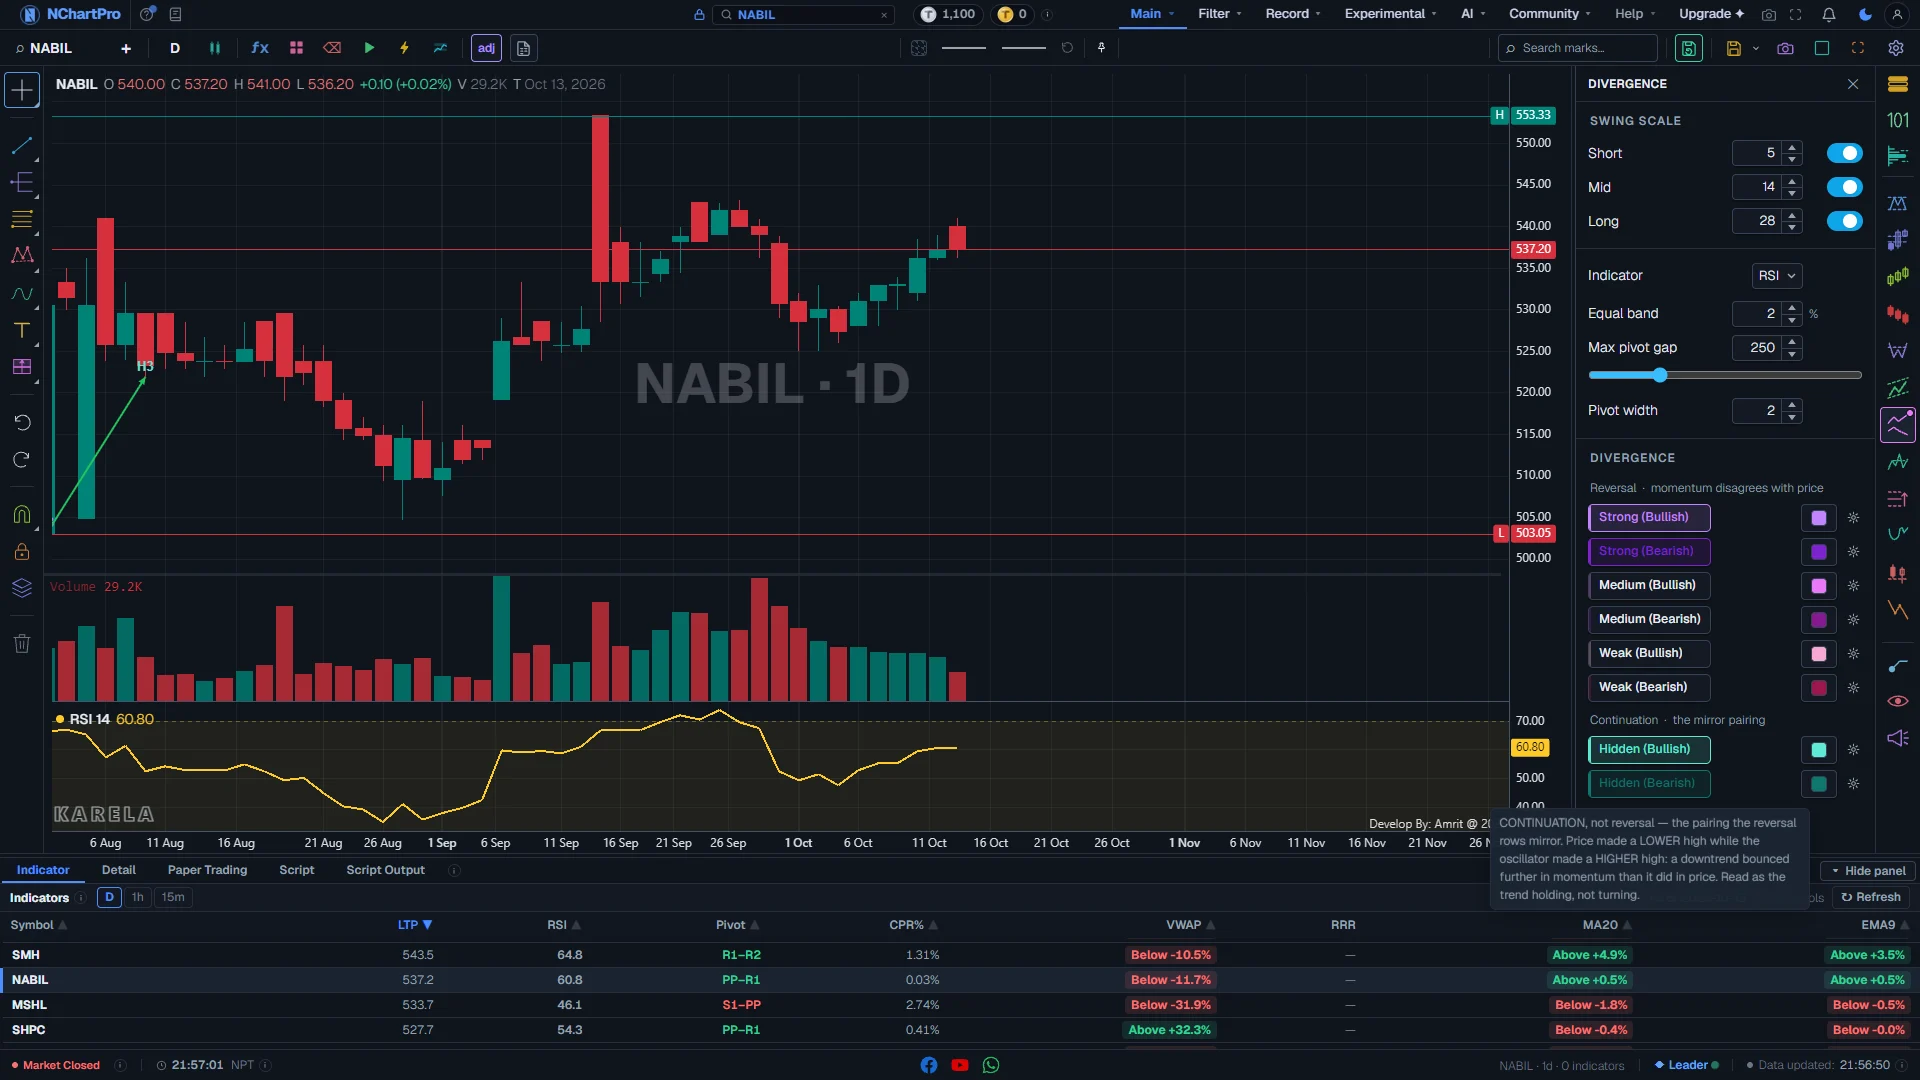
The DV chip opens one panel in three blocks. The top block, Swing scale, sets the three momentum lengths. The middle block sets the momentum indicator and the three dials that decide which swings are compared. The bottom block holds eight switches: six reversal rows and two continuation (Hidden) rows.
Each switch is one kind of divergence in one direction. Nothing is drawn until you switch a row on, and the rail chip shows a small dot while any row is on.
Divergences are found on the candles in your browser, on any timeframe. There is no older server version any more.
Why it helps you
- Divergence warns that a move is tiring. It is not a signal to act on its own. Price can diverge for weeks and keep going. Wait for the price itself to break a swing before you act.
- Start with Strong only. If Strong finds nothing on the stock you are watching, the disagreement you thought you saw is not there.
- A bearish divergence near your target is a reason to take profit or tighten your stop. In NEPSE you cannot sell short, so a bearish reading means exit or stay out, never "sell to open".
- Hidden (Bullish) on a pullback inside an uptrend is the reading that supports holding or adding. It is the most useful row for someone already in a trade.
- Use the weekly chart and the Long scale. A Strong (Bearish) tag at the end of a long rise takes months to form and describes months of behaviour.
- Money Flow Index is a good choice for a long view, because it counts volume as well as price.
- Ignore Weak and Short. At an investing horizon, only the clear divergences matter.
When to use it, and where to find it
- Late in a move, after a long run. A divergence at the start of a trend is mostly noise.
- When price has just made a new high or low and you want to know if momentum went with it.
- Before adding to a winning position, as a check against it.
Try it — a short walkthrough
- 1Open DV on a daily chartPick the 1 day timeframe, then click the DV chip on the right rail. Leave the Indicator on RSI and all three scales on.
- 2Switch on Strong, both waysClick Strong (Bullish) and Strong (Bearish). Arrows and "S" tags appear on the candles, and a momentum pane opens under the chart.
- 3Check one divergence by eyeFind an "S" tag. Follow its price arrow, then look straight down at the momentum pane. The two arrows should point different ways.
- 4Cut the noise with Pivot widthRaise Pivot width a few steps. Fewer, bigger swings are compared, so fewer and more important divergences stay.
- 5Add Hidden for trendsSwitch on Hidden (Bullish). Teal "H" tags appear on pullbacks inside rises. Turn rows off again before you move to another stock.
The panel and the chart, part by part
The Divergence (DV) panel on NABIL, daily chart, with Strong and Hidden switched on. Each part with a close-up of the real screen; the numbers match the dots on the picture.
Swing scale: Short, Mid, Long
Three momentum lines of different length. Each one finds its own divergences. All three are on to start.
How — Turn a scale on or off with the switch at the end of its row. Type a number or use the arrows to change its length (2 to 50).
- Short = 5, Mid = 14, Long = 28 at the start. The number is the LENGTH of the momentum line (RSI 5, RSI 14, RSI 28), not a number of candles between swings.
- A short line reacts fast and finds many small divergences. A long line is slow and finds fewer, bigger ones.
- When the same two swings show a divergence on more than one scale, it is drawn only once, under the longest scale it passes.
- The momentum pane under the candles shows the scale you just changed for a few seconds, then goes back to Mid.
Indicator and Equal band
Which momentum line price is compared with, and how close two swings must be to count as "equal".
How — Pick an indicator from the list. Raise Equal band if you see too many Medium and Weak marks; lower it to see more.
- Indicator: RSI (the default), MACD line, Stochastic %K, CCI, Money Flow Index, Percent Range, Awesome Oscillator, Rate of Change, On-Balance Volume, TRIX.
- MACD line, Awesome Oscillator and On-Balance Volume have no length, so the three scales give the same line for them.
- Equal band: 0 to 10 %, start 2 %. Two swings closer than this are treated as level, not higher or lower. Medium and Weak depend on it.
Max pivot gap
How many candles apart the two swings may be and still be compared.
How — Drag the slider or type a number (5 to 1000, start 250). Lower it to keep only recent, close-together pairs.
- A bigger gap finds more divergences, including pairs months apart.
- A smaller gap keeps the chart cleaner and the readings more recent.
Pivot width
How many candles on each side a high or low must beat to count as a swing.
How — Use 3 to 5 for a normal view. Raise it to compare only big swings; this is the best way to cut noise.
- Range 1 to 50. This dial belongs to Divergence only — the Depth dial on other panels does not move it once it is set here.
- If you see a divergence by eye but nothing is drawn, the two swings are probably too small for this width. Lower it.
Reversal rows: Strong, Medium, Weak
Six switches, a bullish and a bearish row for each kind. Each row button wears its own colour.
How — Click a row to turn it on. Click the colour box to change its colour or line. The gear opens its settings, including "Use row colour".
- Strong: price made a new low (or high) and momentum did NOT. The textbook warning that the move is tiring.
- Medium: price made an EQUAL low (or high), but momentum turned up (or down) anyway.
- Weak: price made a new low (or high) and momentum stayed level. Momentum did not follow the move.
- The names are KINDS, not a strength score. Weak does not mean "probably wrong".
- Bullish rows compare two LOWS; bearish rows compare two HIGHS.
- Row colours (bullish light / bearish dark): Strong violet #c084fc / #7e22ce, Medium pink-purple #e879f9 / #86198f, Weak pink #f9a8d4 / #9d174d.
What is drawn on the chart
Each divergence is two arrows and a tag: one arrow joins the two price swings, one joins the same two points on the momentum line.
How — Read the two arrows together. If they point different ways, that is the divergence. Nothing needs a click — every mark that is on is drawn.
- Arrow colour shows which way THAT line moved: green = it went up, red = it went down, grey dashed = level (inside the Equal band).
- Tag (in the row colour): a letter and a digit. Letter = kind: S Strong, M Medium, W Weak, H Hidden. Digit = scale: 1 Short, 2 Mid, 3 Long. "S3" = Strong on the Long scale.
- Line thickness also shows the scale: Long is drawn thickest, Short thinnest.
- The momentum pane (RSI 14 by default) opens under the candles by itself the first time a row is on. If you close it, it comes back after a reload.
- With "Use row colour" on (in the gear), both arrows take the row colour and line type instead of green, red and grey.
Reading the numbers
- Swing: a high or low that beats the candles on each side of it (how many is the Pivot width).
- Momentum line: the oscillator (RSI by default) that price is compared with.
- Regular divergence (Strong, Medium, Weak): price and momentum disagree — the move may be ending.
- Hidden divergence: the reverse pairing — the trend is still holding.
- Bullish compares two lows. Bearish compares two highs.
- Equal: two swings closer than the Equal band are treated as level.
What it does not do
- Divergence is early by nature, and often too early. You can be right about a top and wrong about the timing by a month.
- The last candle is not final while the market is open. A divergence that ends on it can change or disappear by the close.
- Only the candles loaded on the chart are read. Scroll back to load older history if a divergence starts before it.
- A divergence is a reading of the past, not advice to buy or sell.
Questions people ask
Which side moved. Strong: price made a new extreme and momentum went the other way. Medium: price stayed level but momentum turned. Weak: price made a new extreme and momentum stayed level. They are three kinds of disagreement, not three strengths.
The letter is the kind (S Strong, M Medium, W Weak, H Hidden). The digit is the scale (1 Short, 2 Mid, 3 Long). The tag is in the row colour, so the colour tells you bullish or bearish.
Usually the Pivot width. Only swings that beat that many candles on each side are compared. Lower Pivot width, raise Max pivot gap, or switch on the Short scale.
No. DV adds it so the second arrow has somewhere to be drawn. You can close it; it returns after a reload while a DV row is on.