

Candle Patterns
A candle pattern is the shape of one candle, or of two or three candles in a row. Traders have given names to many of these shapes, like Doji, Hammer and Engulfing. They read them as a hint that a move may pause or turn. Two chips do this work. The green CN chip marks the shapes on the stock you are looking at. The red CP chip just below it lists every stock in the market that has just made a shape you pick.
What this page is
The green CN chip marks shapes on the one stock you are looking at, through its whole loaded history and on any timeframe. The red CP chip under it is a scanner. It looks only at the newest candle of every stock and lists the stocks that made the shape you pick. They answer two different questions: "where did this stock make a hammer?" and "which stocks made a hammer today?".
The CN panel has 31 rows in four groups that are always open: One candle, Two candles, Three candles and Five-bar window. Each group is split into small sub-groups by meaning, so shapes that look alike but mean opposite things are kept apart.
The scanner reads a file that the server makes in advance for 15-minute, 1-hour, daily and weekly candles. It does not search history.
Why it helps you
- Candle shapes are timing tools, not direction tools. They help when price is already at a level you care about, such as support or an old high.
- Use the scanner after the close to make a short list. For example, pick Engulfing on 1D and walk through the Bull matches one by one.
- Switch on a confirmed row and its early row together. You see the shape as soon as it prints, and you also see whether the next candle agreed.
- On a weekly chart one candle is a whole week. A hammer on a weekly chart after a long fall is worth noticing.
- On a daily chart these shapes are mostly noise for a long-term holder. One indecisive day is not a reason to change a long position.
- If you use any of these, use the three-candle star shapes at the end of a long move, and confirm them with the trend.
When to use it, and where to find it
- After the close, when the day's candle is final. A shape read at noon can be gone by 3 pm.
- When price reaches a level you already marked, to see how the candles behave there.
- For a list of stocks to study, use the scanner rather than opening stocks one by one.
Try it — a short walkthrough
- 1Open CN and switch on one shapeClick the green CN chip. Click Bullish Engulfing. Small light-blue triangles appear above the candles where the shape printed.
- 2Add its oppositeClick Bearish Engulfing. Dark teal triangles appear below the candles where sellers swallowed the day before.
- 3Try a confirmed and early pairScroll to the Five-bar window and switch on Hammer — confirmed and Hammer — early. Faded triangles are early hammers; a solid one a candle later means the hammer was confirmed.
- 4Find a shape across the marketClick the red CP chip under CN. Pick 1D, then a shape from the 1 Candle list. Click a stock in the list to chart it; the shape is shaded in yellow.
- 5Switch things off before you move onClick each row again to switch it off. Too many shapes at once make the chart hard to read.
The CN panel and the chart, part by part
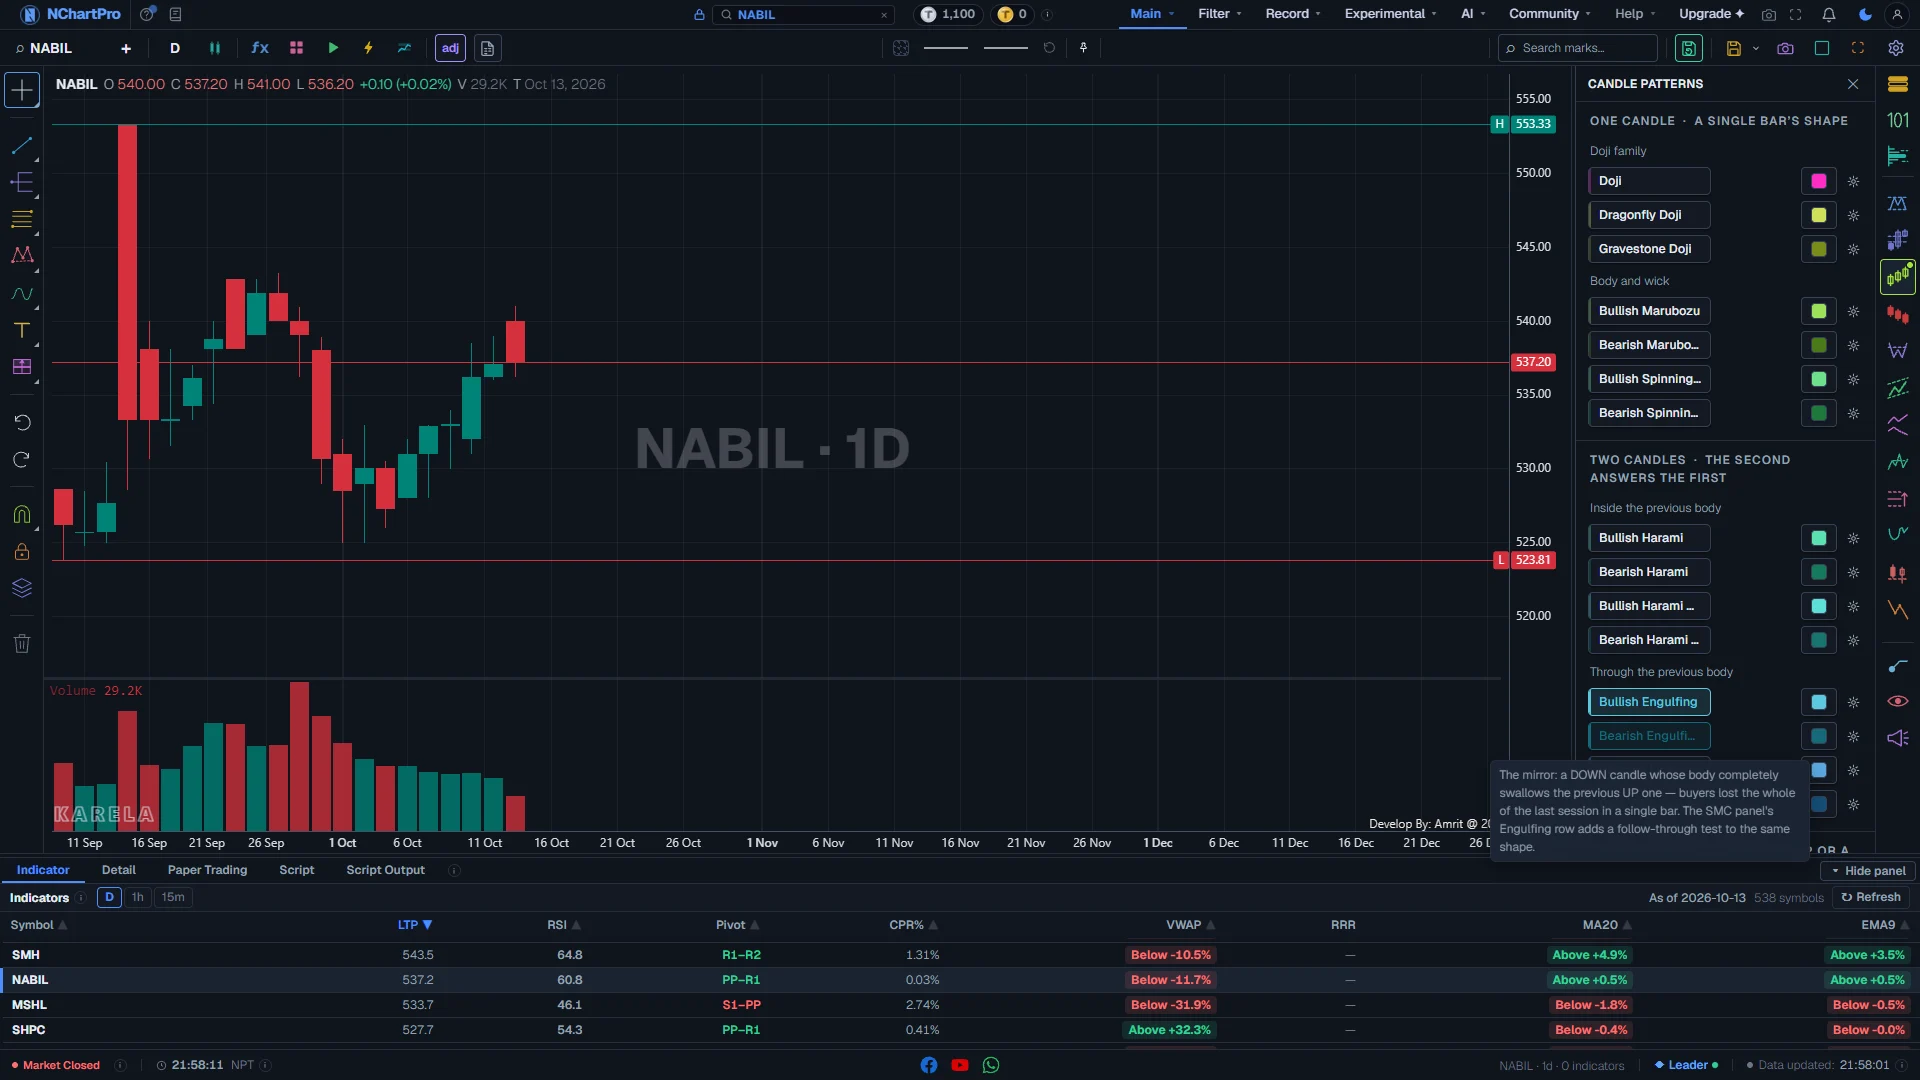
Candle Patterns (CN) open on a daily chart, with Bullish and Bearish Engulfing switched on. Each part with a close-up of the real screen; the numbers match the dots on the picture.
Candle Patterns panel
Opens from the green CN chip in the right-hand column. One panel, 31 rows, no number boxes.
How — Click CN to open it. Click CN again, the ✕, or press Escape to close it. The marks you switched on stay on the chart after you close it.
- There is no Depth, Tolerance or Back count here. These shapes are read from the candles alone, so there is nothing to tune.
- A small dot on the CN chip means at least one row is on.
- Drag the left edge of the panel to make it wider (220 to 520 pixels). The chart gets narrower; nothing is covered.
One candle
Shapes made by a single candle: the Doji family (3 rows) and Body and wick (4 rows).
How — Click a row to switch it on. Use one or two rows at a time — Doji and Spinning Top can mark many candles.
- Doji: open and close at the same price. The day settled nothing.
- Dragonfly Doji: long tail below, no tail above. Sellers pushed it down and buyers brought it all the way back.
- Gravestone Doji: long tail above. Buyers pushed it up and sellers brought it all the way back.
- Marubozu: all body, no wick. Bullish = buyers held it from open to close; Bearish = sellers did.
- Spinning Top: a small body with wicks on both sides. Nobody won the day. The bearish row is measured more loosely, so it fires more often.
One row
Each row is one shape. The button wears the shape's own colour; the box beside it changes that colour.
How — Click the name to switch the shape on or off. Click the colour box to change colour, transparency and marker size. The gear (⚙) opens the same style settings in one box. Hover the name to read what the shape is.
- On: the button fills with its colour. Off: grey, with a thin coloured line at its left edge.
- Every row has its own colour. A bullish row is the light shade, its bearish twin the dark shade of the same colour — for example light blue for Bullish Engulfing and dark teal for Bearish Engulfing.
- Use "Reset style" in the colour box to go back to the built-in colour.
Two candles
The second candle answers the first. Two sub-groups that mean opposite things.
How — Compare Harami with Engulfing on the same chart: they are opposite readings, not two names for one thing.
- Inside the previous body — Harami: a small candle inside the last big body. The move paused; it did not turn. Harami Cross is the same with a doji inside, and it always marks the same candle as Harami too.
- Through the previous body — Engulfing: the new body covers the whole last body. The other side lost the whole of the last day in one candle.
- Piercing Line: after a down candle, the next opens below its low and closes above its middle. Dark Cloud Cover is the mirror at a top.
What is drawn on the chart
One small triangle per shape, on the LAST candle of the shape, in the row's colour.
How — Zoom in to see which candle a triangle points at. Hover the candles to read their prices. Look at where the shape printed — at a support level it means much more than in the middle of a range.
- Triangle ABOVE the candle, pointing down at it: a bullish shape (for example Bullish Engulfing, Hammer, Morning Star, Dragonfly Doji).
- Triangle BELOW the candle, pointing up at it: a bearish shape (for example Bearish Engulfing, Shooting Star, Evening Star), and also plain Doji, Gravestone Doji and Abandoned Baby.
- For a two- or three-candle shape the triangle sits on the last candle of the group.
- A faded (lighter) triangle is an "early" row — the shape printed, but the next candle has not confirmed it yet.
- Shapes are found on every timeframe. The newest candle is still forming while the market is open, so a mark on it can disappear before the close.
The lower groups, part by part
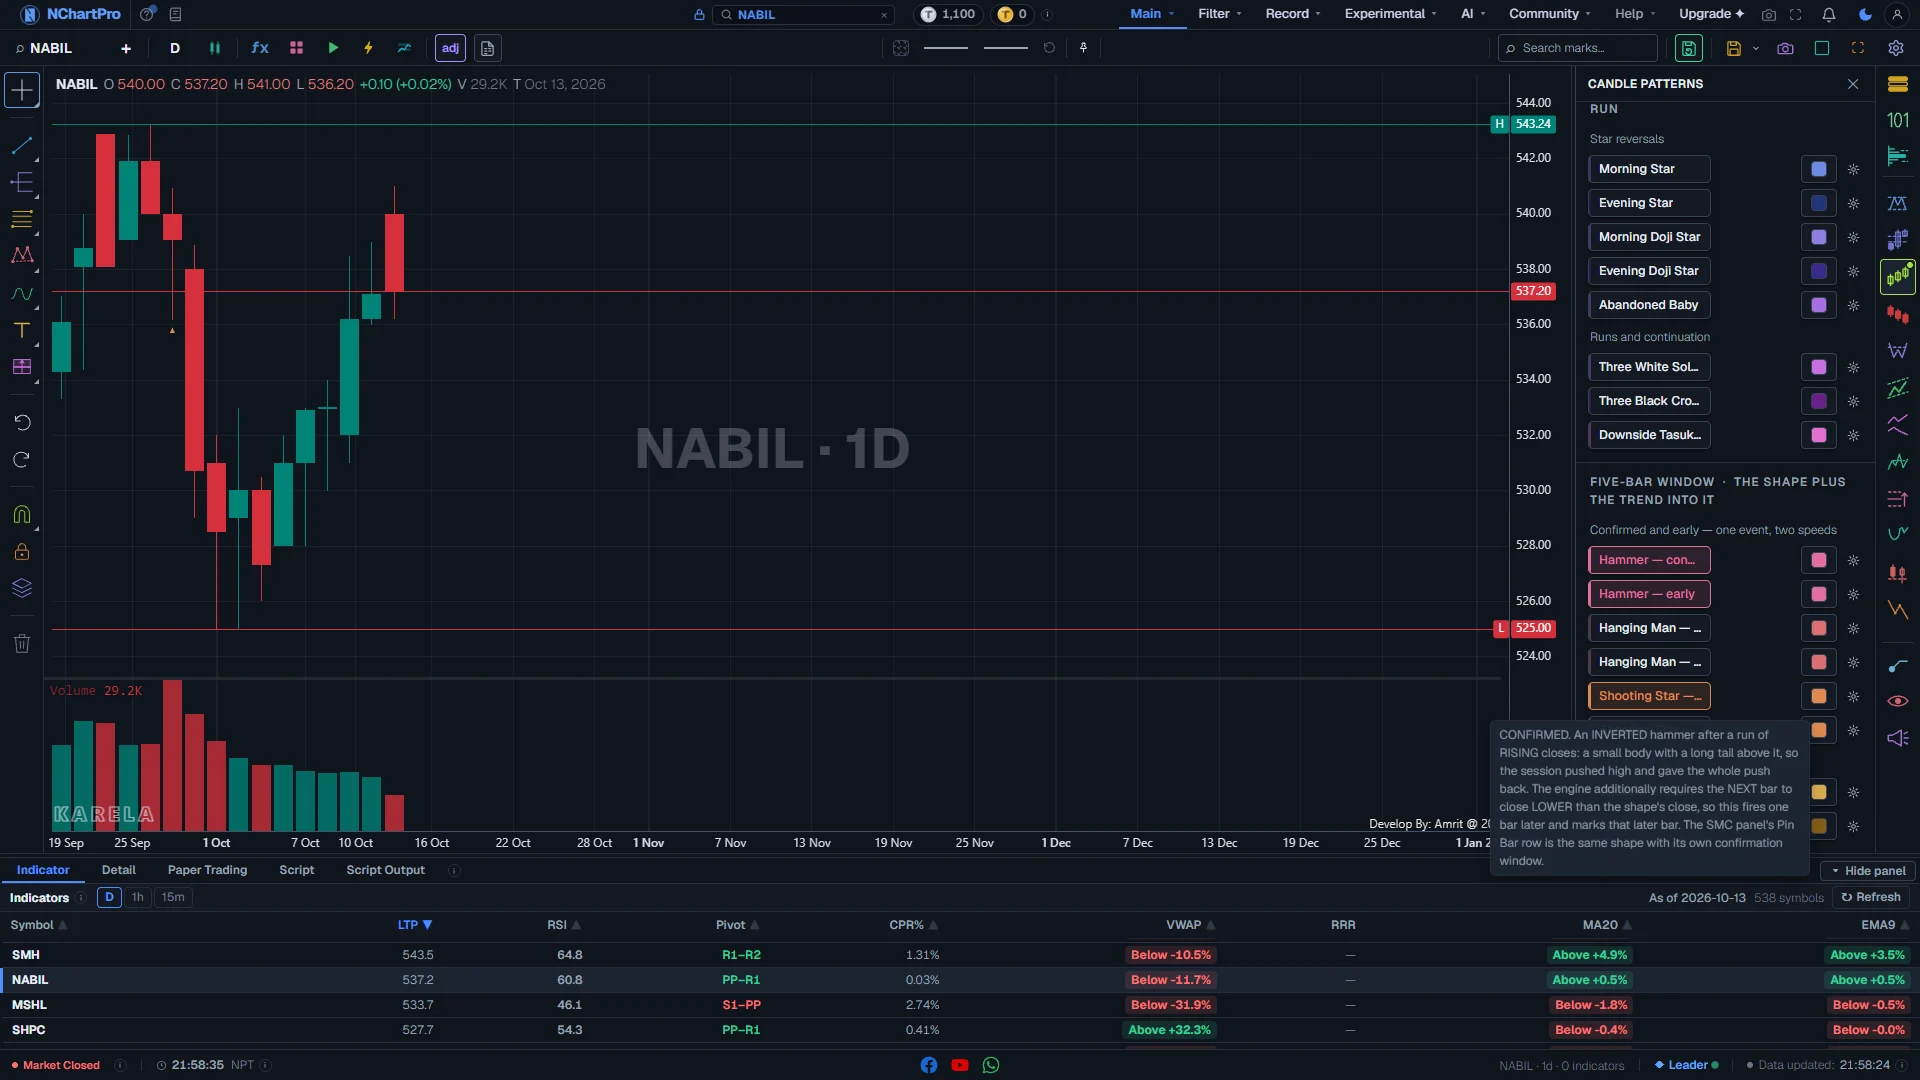
The lower half of the CN panel: three-candle shapes and the five-bar window, with Hammer switched on. Each part with a close-up of the real screen; the numbers match the dots on the picture.
Three candles
A star, a gap or a run: Star reversals (5 rows) and Runs and continuation (3 rows).
How — Use the star rows at the end of a long move. Use the run rows to see whether a move is still strong.
- Morning Star: a big down candle, a small candle that gaps below it, then an up candle closing past the middle of the first. A turn at a low. Evening Star is the mirror at a high.
- Morning / Evening Doji Star: the same with a doji in the middle. They always mark the same candles as the plain star rows too.
- Abandoned Baby: a doji with a gap on both sides. Only the bottom version exists here. The rarest row on the panel.
- Three White Soldiers: three up candles in a row, each closing higher. Three Black Crows: three down candles in a row. These say "the move goes on", not "it turns".
- Downside Tasuki Gap: a gap down that a small up candle fails to fill. It means the fall may continue.
Five-bar window
The shape plus the trend that came into it. The shape itself is one or two candles; the other bars are the trend before it.
How — Read these only where the trend before them is clear. A hammer in the middle of a flat range means little.
- Hammer: small body, long lower tail, after falling closes. Buyers stepped in.
- Hanging Man: the same candle after rising closes. A warning at a high.
- Shooting Star: small body, long upper tail, after rising closes. The push up was given back.
- Tweezer Bottom / Top: two candles with exactly the same low (or high). Exact match only, so they are rare.
Confirmed
Hammer, Hanging Man and Shooting Star come in pairs. The "confirmed" row waits for the next candle.
How — Use the confirmed row when you want fewer, safer marks.
- Confirmed Hammer: the next candle must close higher. Hanging Man and Shooting Star: the next candle must close lower.
- Because it waits, the triangle lands one candle later — on the confirming candle.
Early
The same shape marked the moment the candle prints, without waiting. Same colour, drawn faded.
How — Switch on both rows of a pair. Where a faded triangle has a solid one just after it, the shape was confirmed. A faded one alone has not been, and it can still fail.
- Early is not "wrong". It is a real shape that has not been confirmed yet.
Hammer marks on the chart
Solid triangles are confirmed hammers; faded ones are early hammers one candle to their left.
How — Look for a faded triangle with no solid one after it: that hammer was not followed by a higher close.
The scanner, part by part
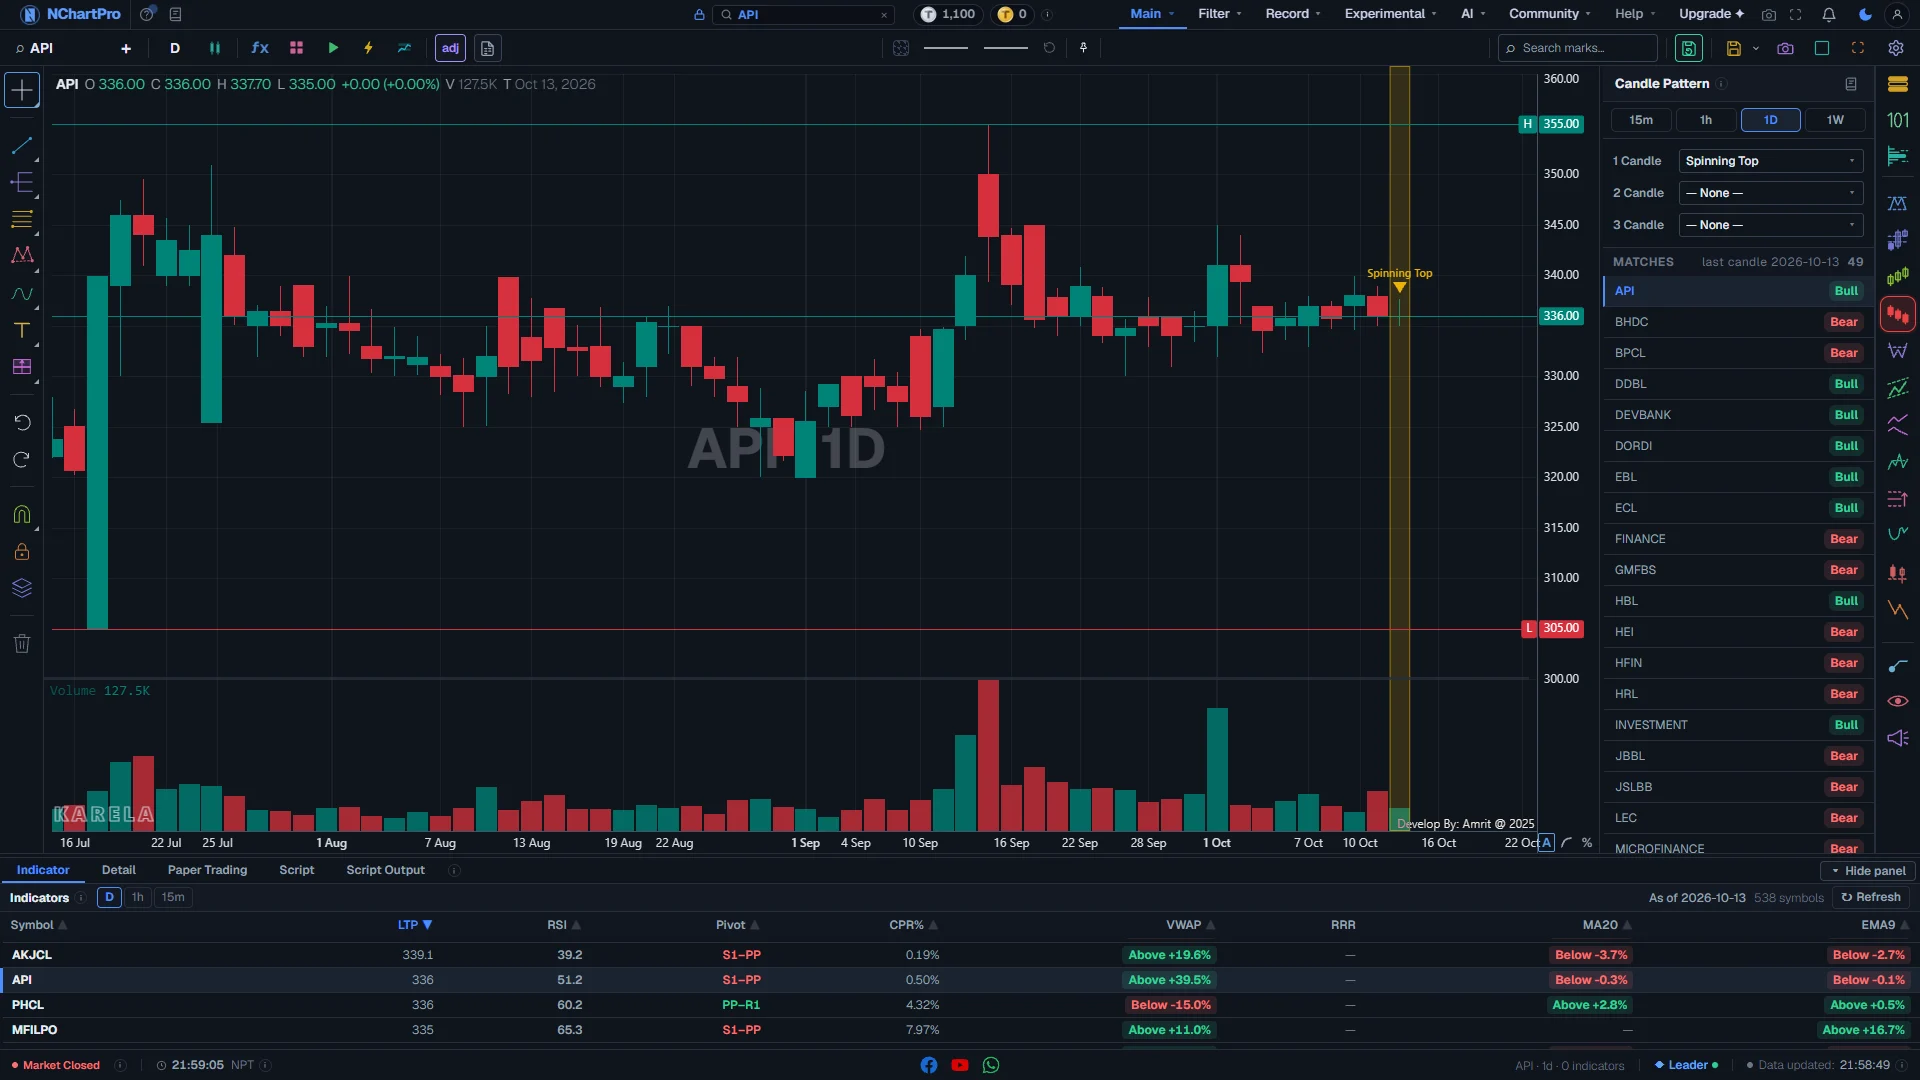
The Candle Pattern scanner (red CP chip): Spinning Top on daily candles, first match charted. Each part with a close-up of the real screen; the numbers match the dots on the picture.
Candle size
Which candles to search: 15m, 1h, 1D or 1W.
How — Click one. The main chart also switches to that timeframe, and the pattern choice is cleared.
- Only these four candle sizes are scanned. On other timeframes the scanner has nothing.
Pick a pattern
Three lists: 1 Candle (17 shapes), 2 Candle (15) and 3 Candle (21). One pattern at a time.
How — Open a list and pick a name. You can type to search. Pick "— None —" to clear. Picking in one list clears the other two.
- The small grey number after a name is how many stocks show that shape on their latest candle. No number means none.
- These are the classic textbook shapes (the TA-Lib set). The list is wider than the CN panel and some names differ — for example Belt Hold, Kicking, Three Inside.
Matches
The heading of the result list: the date of the candle that was scanned, and how many stocks matched.
How — Check "last candle" against the newest candle on your chart. If they differ, the scan is from an older candle.
A matching stock
One stock that made the shape on its latest candle, with a Bull or Bear tag.
How — Click a stock to open its chart. The candles of the shape are shaded so you can check it with your own eyes.
- Bull (green): the shape points up.
- Bear (red): the shape points down. In NEPSE that means a reason to exit or stay out, not to sell short.
- The stock now on the chart is marked with a coloured edge on its left.
The highlight on the chart
The scanner draws in yellow: a shaded band over the 1, 2 or 3 candles of the shape, and a yellow arrow with the pattern name above the last one.
How — Close the scanner to remove the highlight.
Reading the numbers
- Body: the thick part of a candle, between the open and the close. Wick (or tail): the thin line above or below the body.
- Bullish / bearish: describe the shape, not a promise. A bullish shape in a strong fall is still only one candle.
- Confirmed: the next candle closed the right way. Early: the shape printed and the next candle has not been seen yet.
- Subset: Harami Cross, Morning Doji Star and Evening Doji Star always mark the same candles as Harami, Morning Star and Evening Star. Switching both on marks the candle twice.
- Gap: a candle that opens beyond the last candle's range, leaving empty space between them.
What it does not do
- Candle shapes are the weakest kind of signal on the right-hand column, and they are very common. On any day the market prints many of each.
- The newest candle is still forming while the market is open. A mark on it can disappear before the close.
- The scanner only checks the newest candle, only on 15m, 1h, 1D and 1W, and only as fresh as its last file. Check the "last candle" date.
- The CN panel and the scanner use different rule sets. A stock can be in the scanner list for Hammer and show no Hammer triangle on CN, or the other way round.
- Each chip has its own feature key. Your plan may include one and not the other.
- A shape is a reading of the past, not advice. Always check the trend around it.
Questions people ask
Because these shapes are read from the candles alone with fixed rules. A box that could not change any mark would only confuse. Every other mark panel has boxes because their shapes are built from swings.
The triangle points at the candle. Bullish shapes draw it above the high, pointing down; bearish shapes draw it below the low, pointing up. The colour tells you which row drew it.
Compare the "last candle" date in the list heading with the newest candle on the chart. If the file is one candle behind, the two are talking about different candles.
They were removed. Every row is now always visible, so pinning was not needed, and the generic rows marked almost every candle.