

Volume
Price tells you what a share changed hands at. Volume tells you how many people cared. These 41 indicators are the ways of turning the second number into something you can read alongside the first.
What this page is
The volume category holds 41 entries. Seven are overlays drawn on your candles — five of them volume-weighted price lines and two of them volume-at-price profiles — and the other 34 sit in panes.
Volume is the one input on the chart that is not derived from price, which is why this category is worth more than its size suggests. A move on heavy trade and the same move on nothing look identical on the candles and completely different here.
They fall into eight families. The VWAP family produces a price you can trade against. The two profiles show where the trading actually happened rather than when. Raw volume and its rate answer whether today is busy. The accumulation lines weight each bar by where the close sat inside its range. The signed accumulators just add volume up and down. The force family measures pressure. One pair splits busy days from quiet ones. The last three test whether volume is confirming price or arguing with it.
Almost every accumulator here is a running total whose absolute level means nothing, because it depends on which bar the chart happened to start from. On Balance Volume, the A/D line, the Cumulative Volume Index and their relatives are read for direction and for divergence against price, never for their value.
Volume on NEPSE is counted in kitta, and it is not evenly available across timeframes. Historical daily volume is complete; the intraday picture depends on the tick data the chart has loaded for the window you are looking at.
Why it helps you
- A breakout on heavy volume and a breakout on nothing are two different events. This category is the fastest way to tell them apart, and Relative Volume is the single most direct reading for it: 1.0 is a normal bar, 2 and up is what a screener means by unusual volume.
- The Rolling VWAP is a level, not an oscillator. Price above it means the average buyer today is in profit, which is a genuinely different situation from price below it.
- Volume Profile shows which prices actually traded rather than which prices were touched. A shelf where a great deal changed hands tends to act as support or resistance on the way back.
- Divergence between price and On Balance Volume is the classic warning: a new price high that the volume line does not confirm means the move is being carried by fewer participants.
- On a weekly chart, a long stretch of accumulation on the A/D line while price goes nowhere is one of the few volume readings worth acting on at your horizon.
- The Positive and Negative Volume Index pair encode an old idea worth knowing: the crowd trades on busy days and informed money trades on quiet ones. Neither is proof of anything, but the divergence between them is at least a question.
- Thin volume is a risk of its own on a small market. A holding that trades a few hundred kitta a day cannot be exited quickly at any price you would like, and the raw Volume plot is the honest way to check that before buying.
- Ignore the intraday-oriented entries entirely. Trade Volume Index and the delta family are built for tick-level work.
When to use it, and where to find it
- Whenever price does something notable. The first question about any breakout, gap or reversal is whether volume came with it.
- Before buying anything small. Check the raw Volume plot for whether the stock trades enough for your position size to get in and out.
- During a range. Accumulation quietly building while price goes nowhere is exactly what the A/D line and On Balance Volume were designed to reveal.
Try it — a short walkthrough
- 1Filter the catalog to volumeOpen fx and click the volume chip. The counter reads 42 of 276. Seven rows carry an overlay badge and the rest are panes.
- 2Add Relative Volume and read today against normalAdd Relative Volume. It opens a pane plotting each bar volume as a multiple of its own recent average. A bar at 2.5 traded two and a half times what this stock usually does.
- 3Put a level on the chart instead of an oscillatorAdd Rolling VWAP. A single line appears over your candles at the volume-weighted average price of the last 20 bars, which is a price you can measure a fill against.
- 4See where the trading actually happenedAdd Volume Profile Visible Range. A horizontal histogram appears at the right of the chart showing how much volume traded at each price across the bars you can see, with the busiest price marked.
- 5Look for divergence on an accumulatorAdd On Balance Volume. Find a spot where price made a higher high and check whether the volume line did too. If it did not, fewer participants carried that high than carried the last one.
Every part, up close
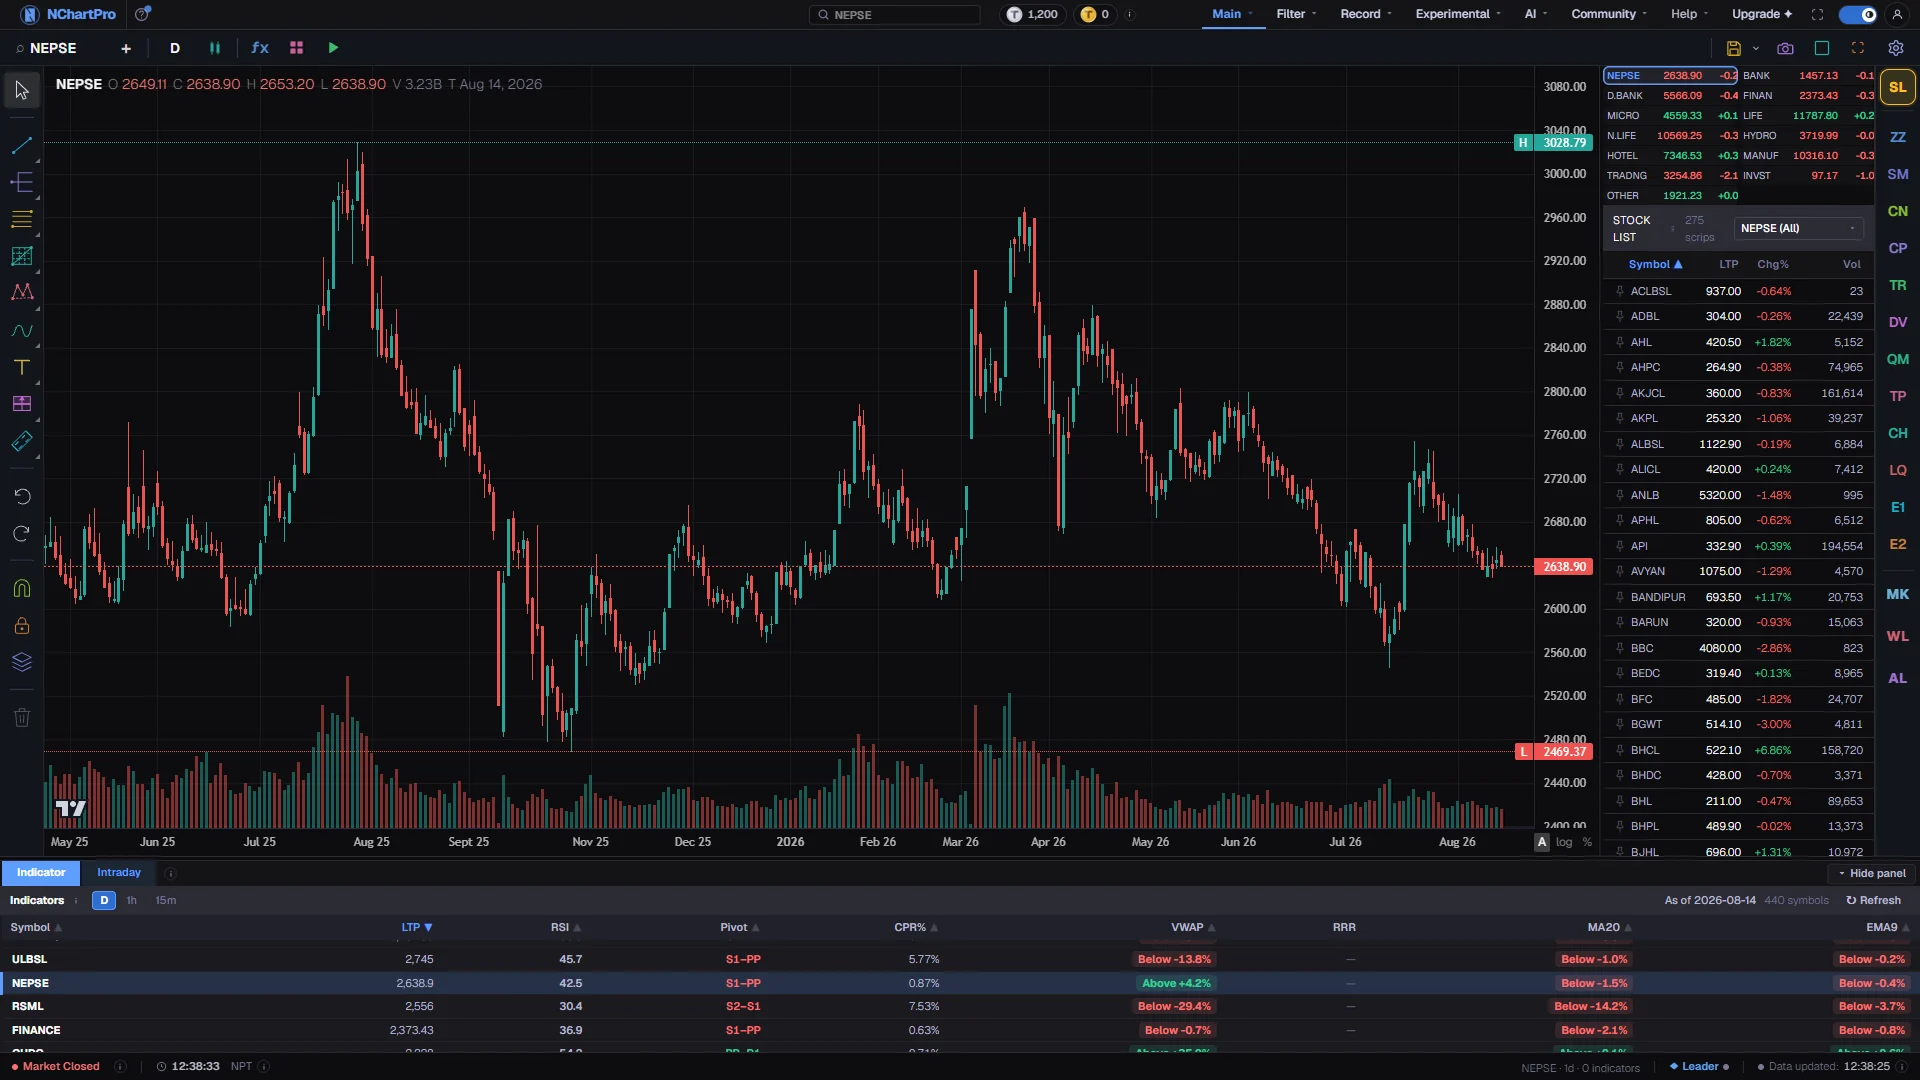
The Chart page — the volume bars along the foot of the price area are what these 41 are built from. Each part with a close-up of the real screen; the numbers match the dots on the picture.
The volume chip
Click volume in fx and the counter reads 42 of 276: five volume weighted price lines, two profiles, and 35 panes.
The traded quantity
The bars under the candles are how many kitta changed hands in each period, and every accumulator in this category is arithmetic on that series rather than on price.
Every indicator in this category
Grouped into families, in the order they are explained. Each preview is the indicator computed on real NABIL daily bars by the same engine the chart runs — click one for a full-size picture and a line-by-line description of what it draws.
VWAP and volume-weighted price5
Five overlays that produce an average price weighted by how much traded at it, so the output is a level on the price scale rather than an oscillator.
| SN | Preview | Indicator | Short name | Draws | What it measures |
|---|---|---|---|---|---|
| 1 | VWAP | overlay | By Classical technical analysis The volume-weighted average price over a rolling window; the level institutions measure their own fills against.Period 20 | ||
| 2 | cVWAP | overlay | By Classical technical analysis The same average accumulated from the first bar on the chart and never reset, so it drifts less and less as the series grows.Reset each session on | ||
| 3 | AVWAP | overlay | By VWAP is standard practice; anchoring popularised by Brian Shannon · Maximum Trading Gains with Anchored VWAP, 2023 · source A volume-weighted average accumulated from the first bar of the loaded series. In this build it anchors to the start of the data rather than to a bar you pick. | ||
| 4 | VWAP Bands | overlay | By Classical technical analysis A rolling VWAP with bands a multiple of the standard deviation either side, so you can see how far from the volume-weighted fair value price has stretched.Period 20, Multiplier 2 | ||
| 5 | VW BB | overlay | By Classical technical analysis Bollinger-style bands built around a volume-weighted average rather than a simple one.Period 20, Std Dev Mult 2 |
Volume at price2
Two overlays that answer where the trading happened rather than when. Both draw a horizontal histogram and mark the busiest price and the range holding the bulk of the volume.
| SN | Preview | Indicator | Short name | Draws | What it measures |
|---|---|---|---|---|---|
| 6 | VRVP | overlay | How much volume traded at each price across the bars currently on screen, with the busiest price and the value-area high and low marked. It rebuilds as you pan. Rows 24, Value Area % 70, Width % of Chart 30 | ||
| 7 | MP | overlay | The same picture built over the whole loaded series rather than the visible window, so it does not change as you scroll. Bins 24, Value Area % 70 |
Raw volume and its rate5
Five panes that read the traded quantity directly, with no reference to where the close sat.
| SN | Preview | Indicator | Short name | Draws | What it measures |
|---|---|---|---|---|---|
| 8 | Volume | pane | By Classical technical analysis The raw quantity traded in each bar, addable like any other indicator. Drawn in one flat colour rather than tinted up and down. | ||
| 9 | VROC | pane | By Classical technical analysis The percentage change in volume against N bars ago. The spike is what you are looking for, not the level.Period 12 | ||
| 10 | Vol Osc | pane | By Classical technical analysis The gap between a short and a long average of volume, as a percentage; above zero participation is picking up.Short Period 5, Long Period 20 | ||
| 11 | RVOL | pane | By Trading community This bar volume as a multiple of its own recent average. 1.0 is an ordinary bar and 2 and above is what a screener means by unusual volume.Length 20, Mode 0 | ||
| 12 | VolStd | pane | By Trading community How erratic volume itself has been, as a percentage of its own mean. Rising means participation is becoming uneven, which is what precedes most range breaks.Length 20 |
Accumulation and distribution lines7
Seven panes that weight each bar volume by where the close finished inside the bar, so a close near the high counts as buying and one near the low as selling.
| SN | Preview | Indicator | Short name | Draws | What it measures |
|---|---|---|---|---|---|
| 13 | A/D | pane | A running total that adds more of the bar volume the nearer the close finished to the high. Rising while price goes sideways means supply is being absorbed. | ||
| 14 | A/D Osc | pane | By Marc Chaikin · published as Chaikin Oscillator · A/D Line, Oscillator and Money Flow — 1970s–80s · source The gap between a fast and a slow average of that line, which turns a slow drifting total into a zero-crossing signal.Fast EMA 3, Slow EMA 10 | ||
| 15 | AMF | pane | By Marc Chaikin · published as Chaikin Money Flow (CMF) · A/D Line, Oscillator and Money Flow — 1970s–80s · source The same weighting summed over a window and divided by total volume, so it reads inside a fixed range instead of drifting forever.Period 20 | ||
| 16 | MFV | pane | The per-bar building block of the A/D line, plotted before it is accumulated. | ||
| 17 | TRMF | pane | The same idea measured against the true range rather than the bar range, which stops an overnight gap being read as accumulation. Period 21 | ||
| 18 | RAD | pane | An accumulator measured against the true high and low, so an up bar only accumulates the part of the move that actually cleared the previous close. | ||
| 19 | III | pane | Where volume traded inside each bar, as a percentage of the period total. The unsmoothed ancestor of Accumulation Money Flow. Length 21 |
Signed volume accumulators9
Nine panes that add volume up on an up bar and down on a down bar. Every one of them is a running total whose absolute level depends on where the chart starts, so read direction and divergence rather than value.
| SN | Preview | Indicator | Short name | Draws | What it measures |
|---|---|---|---|---|---|
| 20 | OBV | pane | Adds the whole bar volume on an up close and subtracts it on a down close. The oldest volume indicator there is, and still the standard one for divergence. | ||
| 21 | OBV MA | pane | The same line with a moving average drawn on it, so the turns are easier to date. Period 20 | ||
| 22 | Net Vol | pane | By Classical technical analysis The cumulative difference between volume on up-close bars and volume on down-close bars. | ||
| 23 | CVI | pane | A running sum of signed volume that leaves a flat close unchanged rather than counting it either way. | ||
| 24 | PVT | pane | By Classical technical analysis On Balance Volume scaled by how far price moved, so a large day counts for more than a one-tick one. | ||
| 25 | Vol Delta | pane | By Trading community · order-flow concept; our per-bar delta is an estimate Estimated buying minus selling volume for each bar, inferred from where the close sat because this chart carries no trade-by-trade data. | ||
| 26 | CVD | pane | By Trading community · order-flow concept; our per-bar delta is an estimate A running total of that same estimate. Read it for divergence against price and never as an absolute figure.Reset Every 0, Signal Length 0 | ||
| 27 | TVI | pane | By Classical technical analysis Accumulates volume only once price has moved further than a minimum tick, holding its direction through everything smaller. Built for intraday charts where most bars are noise inside the spread.Minimum Tick 0.05 | ||
| 28 | TSV | pane | Volume signed by the bar-to-bar price change and summed, then smoothed. Crossings of zero mark accumulation turning into distribution. Length 18, Signal Length 10 |
Volume force and pressure6
Six panes that ask how hard the traded quantity was pushing rather than merely which side it fell on.
| SN | Preview | Indicator | Short name | Draws | What it measures |
|---|---|---|---|---|---|
| 29 | UDVR | pane | By Classical technical analysis Volume on up-close bars divided by volume on down-close bars over the lookback; above 1 the buying side has been busier.Period 10 | ||
| 30 | VFO | pane | The gap between a short and a long average of a volume-force series, meant to separate real accumulation from ordinary turnover. Short EMA 34, Long EMA 55 | ||
| 31 | VF Signal | pane | By Stephen J. Klinger · published as Klinger Volume Oscillator — signal line · S&C, December 1997 · source The signal line of that family on its own, from a simplified force series.EMA Period 13 | ||
| 32 | HPI | pane | By John Herrick · published as Herrick Payoff Index (HPI) · no primary publication traceable · source A cumulative measure of volume against the size of each midpoint move, signed by direction. | ||
| 33 | VZO | pane | Signed volume against total volume as a percentage, so it reads how one-sided participation has been on a bounded scale. Period 14 | ||
| 34 | EMV | pane | How far price moved per unit of volume. A high reading means it took very little trade to shift the price, which is what a thin market looks like. Period 14 |
Busy days versus quiet days4
Four panes built on one old idea: that the crowd trades on high-volume days and better-informed money trades on low-volume ones. Each pair updates only on one kind of day and carries its value forward on the other.
| SN | Preview | Indicator | Short name | Draws | What it measures |
|---|---|---|---|---|---|
| 35 | PVI | pane | A cumulative index that updates only on bars where volume rose against the bar before. | ||
| 36 | NVI | pane | The mirror image, updating only where volume fell. | ||
| 37 | PVD | pane | By Trading community How far price sits from its own average, updated only on days volume increased and held flat otherwise. A simplified reading of the same idea rather than the classic index.Period 20 | ||
| 38 | NVD | pane | By Trading community The same, updated only on days volume decreased.Period 20 |
Confirmation gauges3
Three panes that do not measure volume itself but whether it is arriving with the price move or against it.
| SN | Preview | Indicator | Short name | Draws | What it measures |
|---|---|---|---|---|---|
| 39 | VPCI | pane | Compares volume-weighted against simple averages over a short and a long horizon to judge whether volume is backing the price trend. Short Period 5, Long Period 20 | ||
| 40 | VPC | pane | By Trading community The plain correlation between each bar return and its volume over the lookback. Positive means volume is arriving with the move; negative means it is arriving against it.Length 20 | ||
| 41 | BW MFI | pane | How much price movement each unit of volume bought. Rising alongside volume is a real move; rising without it is a squeeze. |
The in-house average1
One pane written for this app rather than taken from the standard catalogue.
| SN | Preview | Indicator | Short name | Draws | What it measures |
|---|---|---|---|---|---|
| 42 | Volume MA | pane | By Classical technical analysis The average traded volume over the last N bars, drawn over the volume bars so you can see when activity is unusually high or low.Period 20 |
What it does not do
- Volume Delta and Cumulative Volume Delta are approximations, and their own catalog entries say so. True delta needs a record of every individual trade and which side initiated it; this chart has bars, so buying and selling are inferred from where the close sat in the range. Read the two for divergence against price and never for an absolute quantity.
- The Payoff Index, both Volume Disparity entries and the Volume Force Signal are simplified versions of the indicators they are named after. They are useful for shape and direction; they will not match a figure quoted from another platform.
- Every accumulator here starts from whichever bar the chart loaded first, so its absolute level is an accident of your scroll position. Only the slope and the divergence carry meaning.
- The Anchored VWAP indicator anchors to the start of the loaded series, not to a bar you choose, so it behaves much like Cumulative VWAP. To measure VWAP from a specific bar, use the Anchored VWAP drawing tool instead, in the Prediction and Measurement group on the left rail: it starts from the bar you click.
- Volume is not perfectly comparable across NEPSE listings. A stock with a small free float trades in a different regime from a large bank, so a Relative Volume reading is meaningful against the same stock own history and misleading between two different ones.
- Volume Profile Visible Range recomputes as you pan and zoom, so its point of control moves when you scroll. Market Profile does not, which is the reason both exist.
Questions people ask
Yes. The Volume entry in this category plots the same quantity as an ordinary indicator, which means it gets a legend row, a settings dialog and a pane of its own. The difference is that it is drawn in one flat colour rather than tinted up and down.
On Balance Volume counts the entire bar volume as buying or selling depending on the close against the previous close. The A/D line splits the volume according to where the close sat inside the bar, so it treats a close in the middle of a wide range as inconclusive. On gappy data the A/D line is usually the more honest one.
Because it is a running total of every bar loaded. The value has no meaning on its own; only the direction of the line and whether it agrees with price do.
The band of prices that contains the set percentage of the volume, 70 by default, centred on the busiest price. It is the range in which most of the actual business was done.
They are close to identical in this build, since both accumulate from the first bar of the series. The Anchored entry is there for the day a chosen anchor bar is added.