

Statistical & Cycle
The fifth category is where the measurements live that are not about direction, strength, width or participation. Statistics, cycle detection, and the return and risk series that answer how has holding this actually gone.
What this page is
This category holds 38 entries. Six are overlays and the other 32 sit in panes. It sounds like a leftover bin and it is not: two of the most useful readings in the entire catalog for anyone holding a position for more than a day are here, the drawdown curve and the rolling risk-adjusted return.
They fall into eight families. Two overlays are simply arithmetic on each bar. Six gauges ask whether the market is trending or ranging. Five report the statistics of a straight-line fit. Five are the Hilbert-transform cycle set, which try to measure the rhythm of the market directly. Eight are distribution statistics applied to price. Six are returns and risk. Four read the anatomy of individual bars. The last two are rolling order statistics used as a robust centre line.
The Hilbert set is worth a note on its own. Four of the five report a property of the dominant cycle — its length, its phase, its components, its sine wave — and the fifth, HT Trend vs Cycle Mode, reads 1 while the market is trending and 0 while it is cycling. That fifth one is the switch: the other four only mean something while it reads 0.
The return and risk family reads differently from everything else in the catalog because it is not asking about the next move at all. Drawdown, the rolling risk-adjusted return and downside deviation are portfolio measurements applied to a single price series, and they answer what holding this would have felt like.
Why it helps you
- The Choppiness Index and the Efficiency Ratio on the momentum page do the same job from different directions, and both are worth more than another oscillator: knowing whether you are in a trend decides which of your other indicators to believe.
- Z-Score and Percentile Rank turn how stretched is this into a number comparable across dates and across stocks, which eyeballing the chart cannot do.
- The Fractal overlay marks swing points mechanically, which is a faster and more consistent way to find them than drawing them by hand on every chart you open.
- Gap Analysis and the two candle ratios are the quickest read on the character of recent bars: decisive bodies, long rejection wicks, or a market that keeps opening away from where it closed.
- The Drawdown plot is the single most useful indicator on this page for you. It sits at zero at every new high and shows exactly how far underwater a holding would have been at any point in between, which is the risk that actually causes people to sell at the wrong time.
- Rolling Risk-Adjusted Return answers whether the last stretch of holding paid for the volatility it cost. Above 1 it did, below 0 it did not, and the shape of the line tells you when that changed.
- Rolling Downside-Adjusted Return is the same figure with upside movement no longer counted as risk. Where the two diverge, the returns have been lopsided, and that is worth knowing about a holding.
- Percent Return with Cumulative switched on turns the chart into a plain performance curve from the first bar on screen, which is the honest way to compare two stocks over the same window.
When to use it, and where to find it
- When you want to know what kind of market this is before deciding which indicators to trust. The trend-versus-range family is the direct answer.
- After a long holding period, to see what it actually cost. Drawdown and the rolling risk measures are review tools rather than entry tools.
- When a stock looks extreme and you want to check that against its own history rather than against your impression of it. Z-Score and Percentile Rank both do that in one number.
Try it — a short walkthrough
- 1Filter the catalog to otherOpen fx and click the other chip. The counter reads 46 of 276. Eleven rows carry an overlay badge and the rest are panes.
- 2Plot the underwater curveAdd Drawdown. It opens a pane that touches zero at every new high and dips below it in between. The depth of the deepest trough is how far a buyer at the top would have been down.
- 3Ask whether this is a trend or a rangeAdd Choppiness Index. High readings mean price covered a lot of ground without getting anywhere; low readings mean it went somewhere. Use it to decide whether your trend indicators are worth believing today.
- 4Turn a stretch into a comparable numberAdd Z-Score. A reading of 2 means the close is two standard deviations above its own rolling mean, which means the same thing on any stock on any timeframe.
- 5Build a channel that makes no assumptionsAdd Rolling Quantile twice, once with Quantile set to 0.9 and once at 0.1. The two lines give a distribution-free channel that does not care how fat the tails of the price distribution are.
Every part, up close
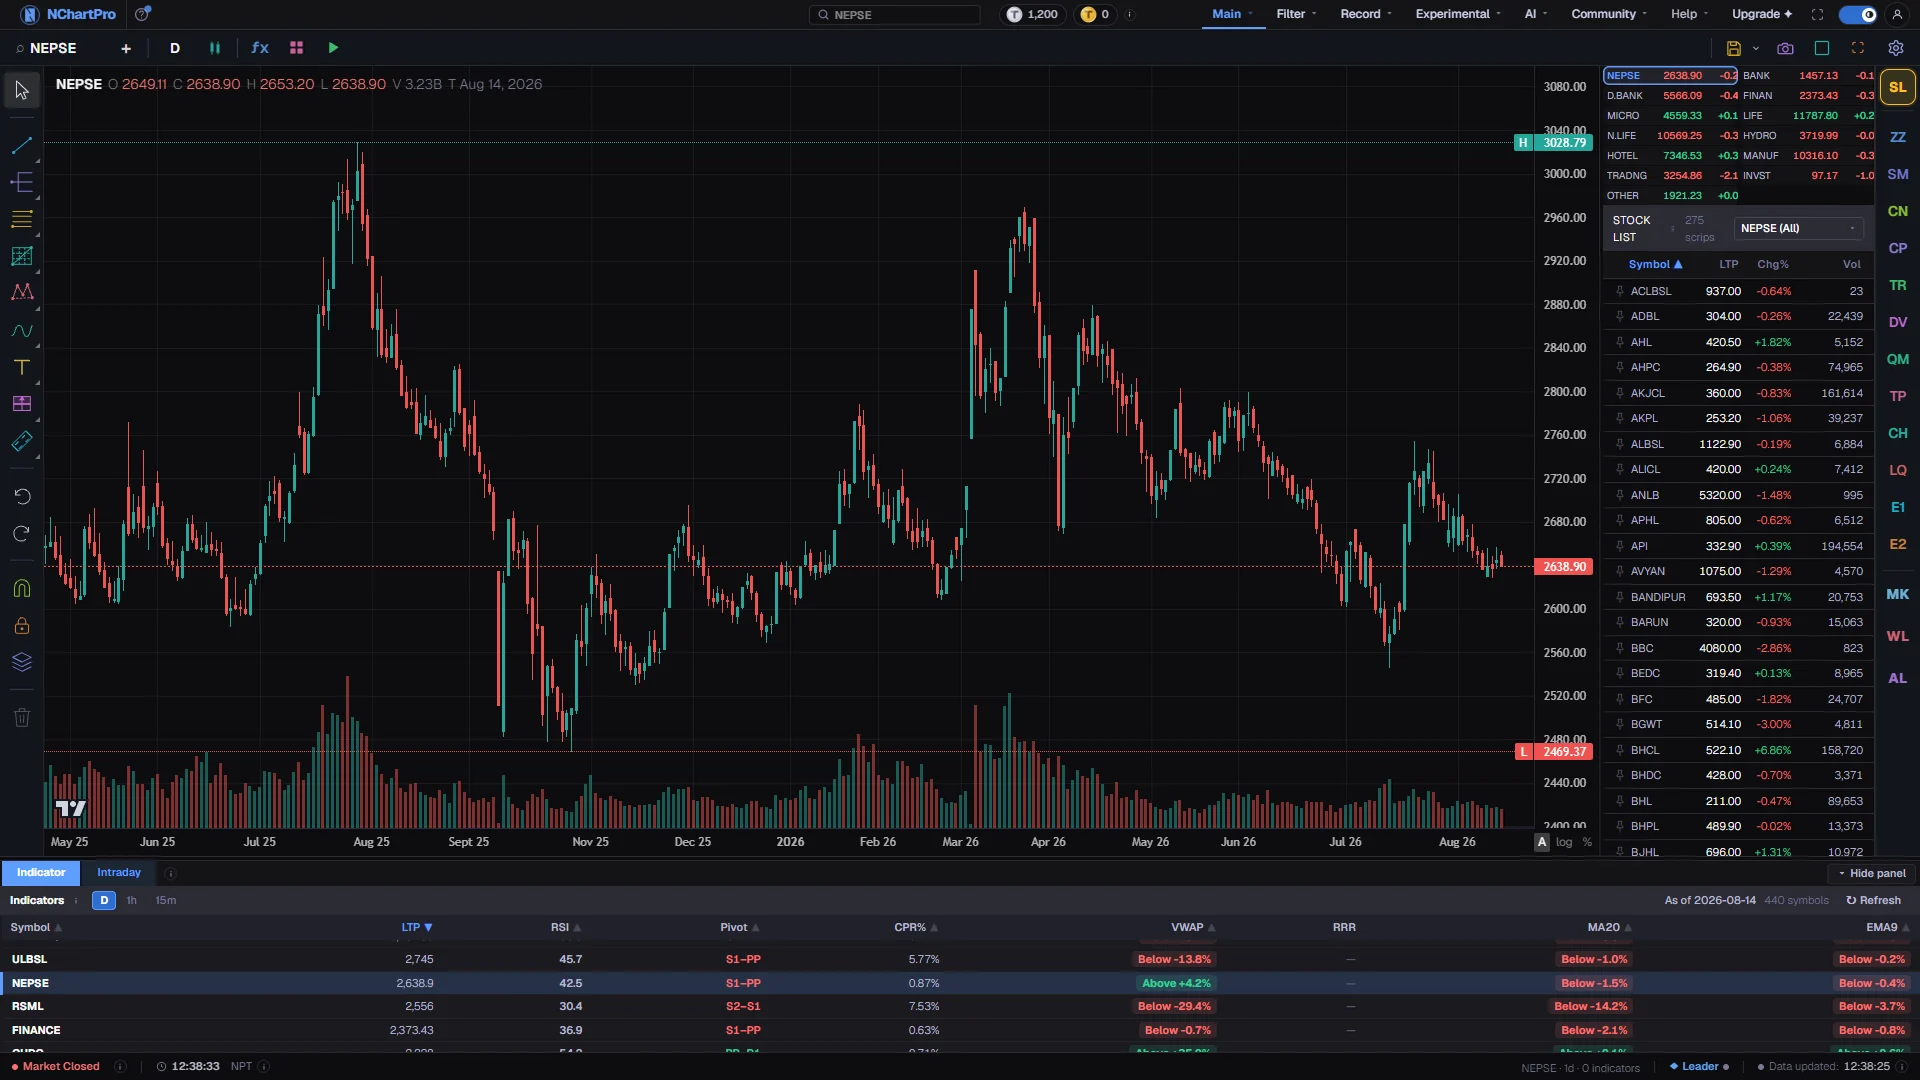
The Chart page — 32 of these 38 open a pane beneath the price, including the drawdown curve. Each part with a close-up of the real screen; the numbers match the dots on the picture.
The other chip
Click other in fx and the counter reads 46 of 276, the smallest category and the one holding the statistics, the cycle set and the return and risk series.
Measured below
A drawdown percentage, a Z-score or a cycle length is not a price, so all but six of these open their own strip under the candles instead of drawing on them.
Every indicator in this category
Grouped into families, in the order they are explained. Each preview is the indicator computed on real NABIL daily bars by the same engine the chart runs — click one for a full-size picture and a line-by-line description of what it draws.
Price lines from bar arithmetic2
Two overlays that restate each bar as a single price rather than measuring anything.
| SN | Preview | Indicator | Short name | Draws | What it measures |
|---|---|---|---|---|---|
| 1 | Median Price | overlay | By Classical technical analysis The midpoint of each bar high and low, lightly smoothed into a line.Smoothing 3 | ||
| 2 | Typical Price | overlay | By Classical technical analysis The average of the high, low and close of each bar. It is also the input several other indicators in the catalog are built on. |
Trend versus range6
Six panes that grade what kind of market this is. They say nothing about direction, which is what makes them useful as a filter for everything else on your chart.
| SN | Preview | Indicator | Short name | Draws | What it measures |
|---|---|---|---|---|---|
| 3 | Aroon | pane | How recently the highest high and the lowest low happened, as two 0 to 100 lines; whichever is nearer 100 is the side currently making new extremes. Carries a shaded band at 70 and 30. Period 14 | ||
| 4 | Aroon Osc | pane | The difference between those two lines, as one line through zero. Period 14 | ||
| 5 | Vortex | pane | Two lines measuring upward and downward movement against total range; the crossing marks a change of trend. Period 14 | ||
| 6 | Choppiness | pane | How much ground price covered against how far it actually got. High means range-bound, low means trending. Period 14 | ||
| 7 | ADXR | pane | The Average Directional Index averaged with its own value N bars ago, which smooths it further at the cost of more lag. Period 14 | ||
| 8 | DX | pane | The raw directional index before the smoothing that turns it into ADX; faster and considerably noisier. Period 14 |
Regression statistics5
Five entries reporting properties of a best-fit straight line through recent closes. The regression lines themselves are on the trend page; these are the numbers about the fit.
| SN | Preview | Indicator | Short name | Draws | What it measures |
|---|---|---|---|---|---|
| 9 | Correlation | pane | How closely closes track a straight rising line, from -1 to +1. It measures how linear the trend is, not how steep. Period 20 | ||
| 10 | LR Angle | pane | The slope of the best-fit line stated as an angle in degrees. Period 14 | ||
| 11 | LR Int | overlay | Where that best-fit line would begin, drawn on the price scale. Period 14 | ||
| 12 | R² | pane | What fraction of the movement the straight-line fit explains, from 0 to 1. A trend-quality score independent of direction. Period 14 | ||
| 13 | Var | pane | By Classical statistics The squared spread of closes around their own mean.Period 5, Deviations 1 |
The hilbert transform cycle set5
Five panes that try to measure the market rhythm directly. Read HT Trend vs Cycle Mode first: while it reads 1 the market is trending and the other four are describing a cycle that is not currently there.
| SN | Preview | Indicator | Short name | Draws | What it measures |
|---|---|---|---|---|---|
| 14 | HT DCP | pane | The length in bars of the dominant cycle currently detected. | ||
| 15 | HT DCPh | pane | Where in that cycle the market currently sits, in degrees. | ||
| 16 | HT Phasor | pane | The two components the cycle measurement is assembled from, plotted directly. | ||
| 17 | HT Sine | pane | A sine and a lead sine of the cycle phase; their crossing is the cycle turn, and it only means anything while the market is cycling. | ||
| 18 | HT Mode | pane | 1 when the transform reads the market as trending and 0 when it reads it as cycling. The switch that says whether the other four are worth reading at all. |
Distribution statistics8
Eight panes applying ordinary statistics to the recent closes, which is how you compare a stretch against its own history rather than against an impression.
| SN | Preview | Indicator | Short name | Draws | What it measures |
|---|---|---|---|---|---|
| 19 | MAD | pane | By Classical statistics The average distance of closes from their own mean. Reads like a standard deviation, but one outlier bar moves it far less.Length 30 | ||
| 20 | Skew | pane | By Classical statistics Whether the recent distribution of prices leans up or down; positive means a long tail to the upside.Period 20 | ||
| 21 | Kurt | pane | By Classical statistics How fat the tails of that distribution are. High readings mean extreme bars have been more common than a bell curve would allow.Period 20 | ||
| 22 | Z-Score | pane | By Classical statistics How many standard deviations the close sits from its own rolling mean. The most directly comparable stretch reading in the catalog.Period 20 | ||
| 23 | Pctl Rank | pane | By Classical statistics Where the current close ranks inside its trailing window, from 0 to 100.Period 100 | ||
| 24 | Autocorr | pane | By Classical statistics Whether one bar return tends to be followed by another in the same direction. Positive suggests trending behaviour, negative suggests mean reversion.Period 20 | ||
| 25 | R/S | pane | A long-memory estimate: above 0.5 suggests moves persist, below 0.5 suggests they revert, 0.5 is an aimless drift. Period 30 | ||
| 26 | Entropy | pane | How evenly the recent closes are distributed, in bits. At its maximum the window is featureless; a fall means the distribution has concentrated, which is what a trend or a squeeze looks like on this measure. Length 10, Log Base 2 |
Returns and risk6
Six panes that measure the price series as a holding rather than as a signal. These are review tools, and the most useful entries on this page for anyone with a horizon longer than a day.
| SN | Preview | Indicator | Short name | Draws | What it measures |
|---|---|---|---|---|---|
| 27 | LogRet | pane | By Classical statistics The natural log of the price ratio over N bars. Unlike a plain percentage it adds up across bars, which is why every volatility model is built on it.Length 1, Cumulative off | ||
| 28 | Ret % | pane | By Classical statistics Plain percentage change over N bars, or with Cumulative switched on, the running total from the first bar on the chart.Length 1, Cumulative off | ||
| 29 | DD | pane | By Classical statistics How far price sits below its own running peak, as a percentage. Zero at every new high and negative in between: the underwater curve.Lookback 0 | ||
| 30 | RAR | pane | By William F. Sharpe · published as Sharpe ratio, applied to a rolling window · Journal of Business, 1966 · source Return over the volatility that produced it, on a rolling window and annualised. Above 1 the last N bars paid well for the risk taken; below 0 they did not pay at all.3 parameters | ||
| 31 | DAR | pane | By Frank A. Sortino & Robert van der Meer · published as Sortino ratio, applied to a rolling window · Journal of Portfolio Management, 1991 · source The same figure with only downside movement in the denominator, so upside volatility stops being counted as risk. It diverges from the reading above exactly when returns have been lopsided.3 parameters | ||
| 32 | DownDev | pane | The scatter of the losing bars only, annualised. Half of the downside-adjusted return, and worth plotting alone as a pure loss-dispersion measure. Length 60, Periods / Year 252 |
Bar anatomy4
Four entries that read the shape of individual candles rather than the relationship between them.
| SN | Preview | Indicator | Short name | Draws | What it measures |
|---|---|---|---|---|---|
| 33 | Gap % | pane | By Classical technical analysis The percentage gap between each open and the previous close. | ||
| 34 | Body Ratio | pane | By Classical technical analysis What fraction of the bar range the open-to-close body occupied. Near 1 is a decisive bar; near 0 is a doji. | ||
| 35 | Wick Ratio | pane | By Classical technical analysis What fraction of the range each wick occupied, plotted separately. A long wick on one side is rejection of that price. | ||
| 36 | Fractal | overlay | Marks the bars whose high or low is the extreme of a five-bar window, which is the mechanical definition of a swing point. |
Rolling order statistics2
Two overlays that give a centre line or a channel without assuming anything about the shape of the price distribution.
| SN | Preview | Indicator | Short name | Draws | What it measures |
|---|---|---|---|---|---|
| 37 | Median | overlay | By Classical statistics The middle close of the last N bars. A centre line a single spike cannot drag, which makes it better than a mean on gappy data.Length 20 | ||
| 38 | Quantile | overlay | By Classical statistics The close at any percentile of the last N bars. Add two, at 0.9 and 0.1, and you have a channel that makes no assumption about how fat the tails are.Length 50, Quantile 0.5 |
The in-house pack8
Eight entries written for this app rather than taken from the standard catalogue. They are grouped here because they belong to none of the families above; the engine is the definition of each, and what it computes is stated plainly below.
| SN | Preview | Indicator | Short name | Draws | What it measures |
|---|---|---|---|---|---|
| 39 | AMA | overlay | Adaptive Moving Average. Speeds up when price is trending cleanly and slows down when it is choppy, using the ER setting to decide which. ER Period 10, Fast 2, Slow 30 | ||
| 40 | cyclex | pane | By Amrit Shrestha — NChart Pro A smoothed line that tries to show the repeating rhythm of pushes up and pull-backs.Length 14, Smooth 3 | ||
| 41 | fast_div | pane | By Classical technical analysis The gap between a fast and a slow average of price, which widens as momentum builds and narrows as it fades.Fast 5, Slow 34 | ||
| 42 | PPMA | overlay | By Classical technical analysis A fast and a slow moving average drawn together; where they cross is the usual signal that short-term direction has changed.Fast 5, Slow 13 | ||
| 43 | tcr_long | overlay | By Amrit Shrestha — NChart Pro An in-house trend line tracking the upside of a move, drawn as a guide for holding a buy.Period 20, Adj 5 | ||
| 44 | tcr_short | overlay | By Amrit Shrestha — NChart Pro An in-house trend line tracking the downside of a move, the mirror of TCR Long.Period 20, Adj 5 | ||
| 45 | trendcycle | pane | By Classical technical analysis One smoothed line that hints whether the market is trending or just drifting sideways. | ||
| 46 | ZLMA | overlay | By Classical technical analysis Zero-Lag Moving Average. A moving average tuned to react with less delay than a normal one, at the cost of being a little noisier.Length 20 |
What it does not do
- The Rescaled Range Exponent is a simplified single-scale approximation, and its own catalog entry says so. It is not the full multi-scale estimate the name implies, so read whether it sits above or below 0.5 rather than the exact figure.
- The Hilbert transform set assumes there is a cycle to find. In a trending market the reported cycle length wanders and the phase is meaningless, which is exactly what HT Trend vs Cycle Mode is there to tell you.
- The annualised risk measures assume 252 periods per year by default. Change it to match the timeframe you are on, or read the shape of the line rather than the absolute number.
- The rolling risk-adjusted return is computed from the price series alone. It is not a portfolio figure and it takes no account of when you actually bought, of dividends, or of anything you hold beside this one stock.
- Skewness, Kurtosis and Autocorrelation are noisy on short windows. On a 20 bar window a single large day dominates all three, which is a property of the statistic and not a fault.
- Drawdown with Lookback at 0 measures from the running peak of the whole loaded series, so scrolling further back can change the depth it reports.
Questions people ask
Because the catalog labels it that way, and the label is honest: these are the measurements that are not primarily about direction, strength, width or participation. It is not a category of leftovers, and the drawdown and risk entries in particular are among the most useful in the whole 276.
On the momentum page. The Average Directional Index itself and the four directional lines are filed under momentum; only ADXR and the raw Directional Movement Index landed here.
No. It is zero at every new high by definition, and only goes negative between one peak and the next. A long flat run at zero means the stock kept making new highs.
The risk-adjusted return divides by all volatility; the downside-adjusted return divides only by the losing moves. When a stock rises in violent jumps the first one punishes it for that and the second does not, which is why the two diverge exactly where the returns are lopsided.
Yes. It is a single-line overlay, so it appears under On this chart in the Calculate on row of any pane indicator. It is a good choice on a gappy stock, because a single spike bar cannot drag it the way it drags a mean.