

Volatility
Volatility indicators measure how far price is moving, with no opinion about which way. That sounds like a secondary question until you size a position or place a stop, at which point it becomes the only one that matters.
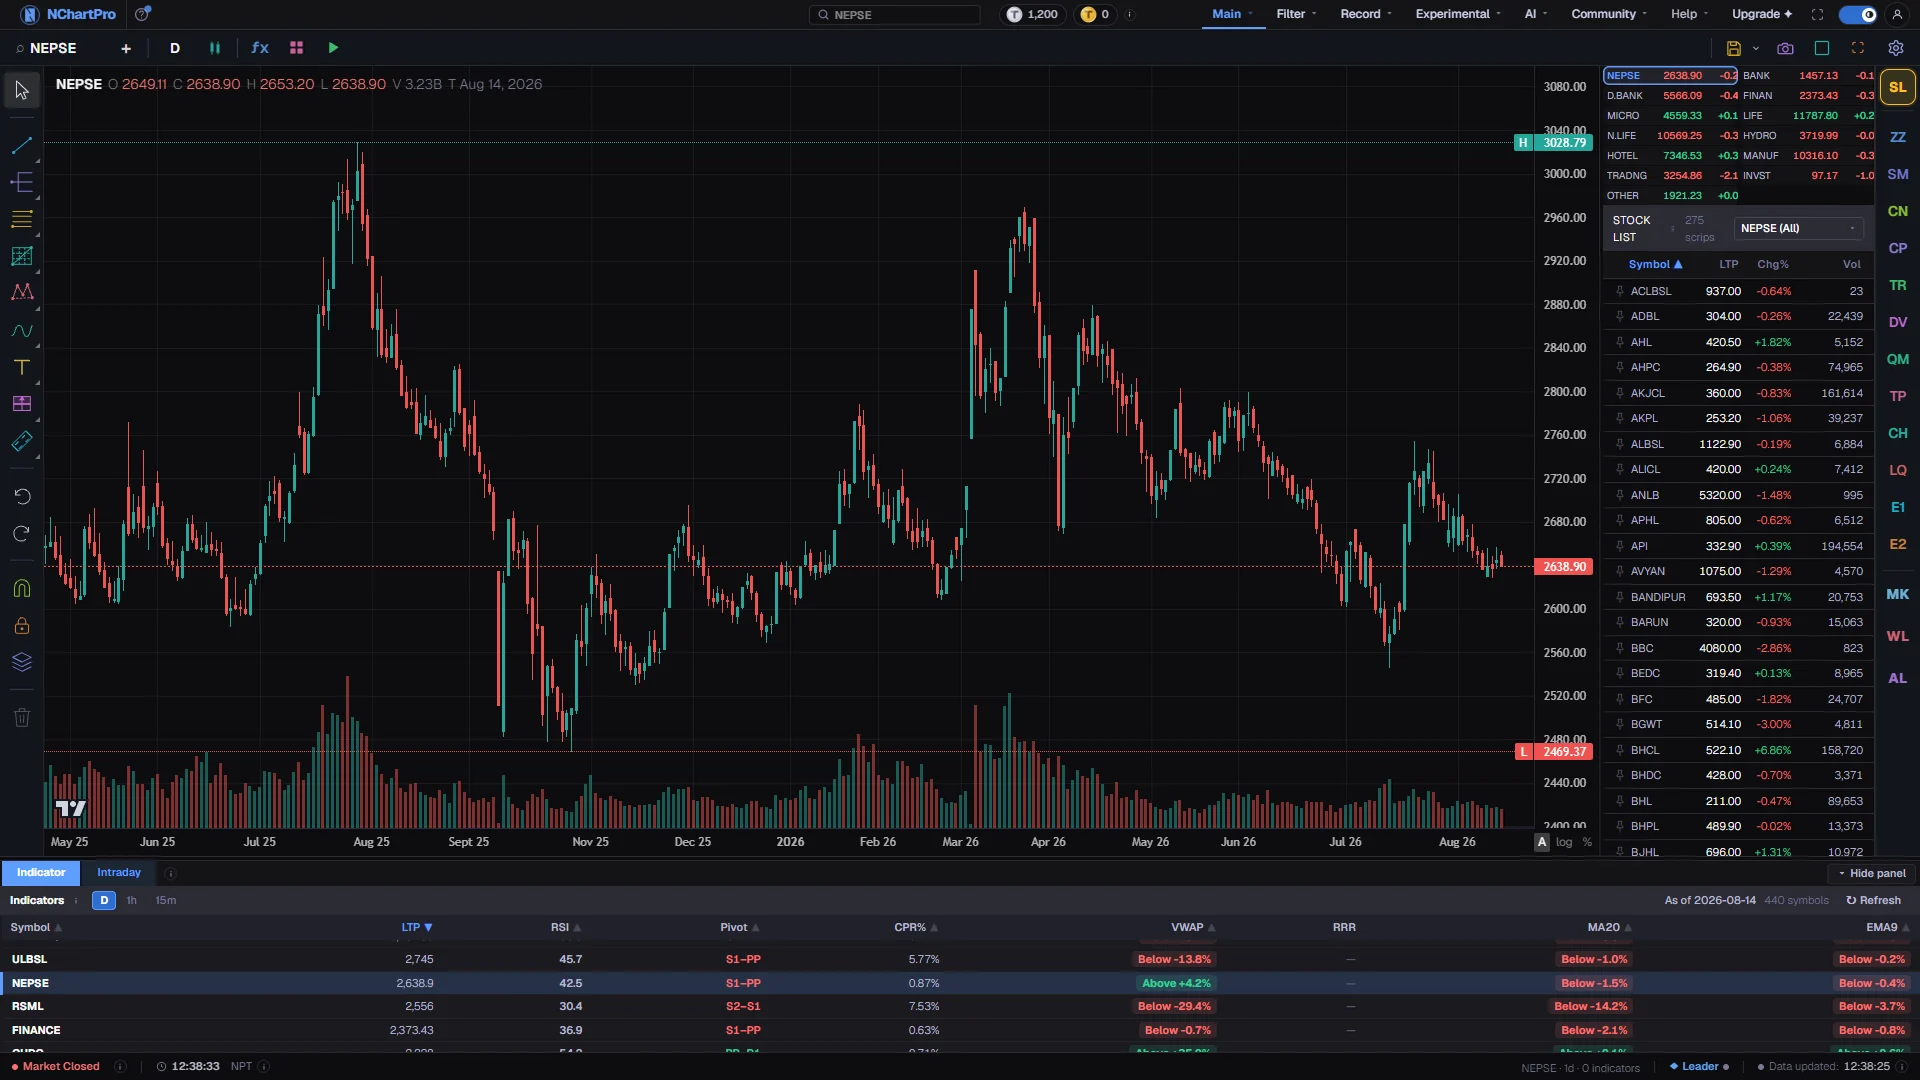
What this page is
The volatility category holds 36 entries. Nine of them are overlays, drawn on your candles as bands or stops, and the other 27 sit in panes because what they produce is a width, a percentage or an annualised figure rather than a price.
They divide into six families. The first draws bands and stops around price. The second is built on true range, the distance a bar covered including the gap from the previous close. The third is ordinary statistical dispersion applied to price. The fourth are the estimators that squeeze more out of each bar by using the high, the low and the open as well as the close. The fifth is the two readings taken off Bollinger Bands. The last is a set of gauges that describe the market state rather than a magnitude.
Two things are worth knowing before you pick one. Volatility is symmetric: nearly everything here rises just as fast in a crash as in a rally, and the Ulcer Index is the one entry that deliberately counts only the downside. And volatility clusters, which is why a quiet market usually stays quiet for a while and a rough one stays rough — that persistence is the single most reliable thing on this page.
The true-range family is the practical one. Average True Range is the number most stop-placement and position-sizing rules are built from, and Normalized ATR is the version you can compare between a rupee 50 stock and a rupee 5,000 index.
Why it helps you
- Size your position from Average True Range rather than from a fixed rupee amount. Two stocks that both move one percent a day are not the same risk if one of them regularly gaps.
- Bollinger Band Width at a multi-month low is the most useful single reading in this category. Ranges do not last, and the width tells you when one has gone on unusually long.
- Use volatility to decide how wide a stop has to be, not whether to take a trade. A stop placed inside the normal noise of a stock will be hit by the noise.
- The Synthetic VIX is worth knowing about because it spikes at panic lows rather than at highs, which is the opposite of most things on the chart.
- Historical Volatility on a weekly chart tells you what kind of ride a holding has actually been, and it is a far better answer to how risky is this than any single-day move.
- The Ulcer Index measures how deep and how prolonged the drawdowns were, which is the form of risk that actually makes people sell at the bottom. It suits a long horizon better than a two-sided volatility number.
- Rising volatility during a long uptrend is worth noticing. Calm markets that get rough usually stay rough for a while.
- The four OHLC estimators are mostly of academic interest at your horizon; Historical Volatility and the Ulcer Index are enough.
When to use it, and where to find it
- Before placing a stop or deciding a position size, every single time. This is the category that turns a guess into arithmetic.
- When a market has gone quiet and you want to know how quiet by historical standards. Bollinger Band Width and the Volatility Ratio both answer that.
- After a shock, to judge whether the market is settling. A volatility reading that has stopped rising is usually the first sign of that, and it turns before price does.
Try it — a short walkthrough
- 1Filter the catalog to volatilityOpen fx and click the volatility chip. The counter reads 36 of 276 and the list mixes overlays and panes, which the badge on each row tells apart.
- 2Add Bollinger Bands and watch them breatheAdd Bollinger Bands. Three lines appear on the candles with a tint between them. Scroll back to a quiet stretch and the bands pinch together; scroll to a sharp move and they flare apart.
- 3Turn the same thing into a numberAdd Bollinger Band Width. It opens a pane and plots how wide those bands are as a single line. The pinch you just looked at is now a trough you can compare with every other trough on the chart.
- 4Get a stop distance out of itAdd Average True Range. Read the value from the legend, multiply it by two, and that is a stop that sits outside the normal bar-to-bar noise of this stock on this timeframe.
- 5Compare across two different stocksSwap Average True Range for Normalized ATR. Because it is a percentage of price rather than a rupee figure, the reading on a cheap stock and an expensive one now mean the same thing.
Every part, up close
The Chart page — eight of these 34 wrap the candles, the other 26 measure them from a pane. Each part with a close-up of the real screen; the numbers match the dots on the picture.
The volatility chip
Click volatility in fx and the counter reads 36 of 276, with a badge on each row saying whether it wraps the price or sits below it.
Bands around price
Bollinger Bands and the ATR channels are drawn over the candles with a tint between their edges, pinching shut through a quiet stretch and flaring open on a sharp move.
Every indicator in this category
Grouped into families, in the order they are explained. Each preview is the indicator computed on real NABIL daily bars by the same engine the chart runs — click one for a full-size picture and a line-by-line description of what it draws.
Bands and stops drawn on price8
Eight overlays that wrap or trail price at a distance set by how rough the market currently is, so the band widens automatically when it needs to.
| SN | Preview | Indicator | Short name | Draws | What it measures |
|---|---|---|---|---|---|
| 1 | BB | overlay | A moving average with bands a number of standard deviations either side, tinted between. They flare when the market gets rough and pinch when it goes quiet, and the pinch is the reading people watch for. Period 20, Std Dev 2 | ||
| 2 | ATR Ch | overlay | By Chester W. Keltner; ATR form by Linda Bradford Raschke · published as Keltner Channels · How to Make Money in Commodities, 1960 · source The same construction with the width taken from average true range rather than standard deviation, also tinted between.MA Period 20, ATR Period 10, Multiplier 2 | ||
| 3 | ACCBANDS | overlay | Bands offset by a fraction of each bar own high-low range, so they widen on the wide bar itself instead of a few bars afterwards. Length 20 | ||
| 4 | STARC | overlay | A short average offset by a true-range multiple, so an overnight gap widens them and a slow quiet drift does not. MA Length 6, ATR Length 15, Multiplier 2 | ||
| 5 | ABER | overlay | A fast centre line inside a slow, stable channel width. The mismatch between the two lengths is deliberate rather than an oversight. Length 5, ATR Length 15 | ||
| 6 | SE Bands | overlay | A regression line with bands at a multiple of the fitting error, so they narrow when price is tracking a straight line closely. Period 20, Multiplier 2 | ||
| 7 | Smoothed Stop | overlay | By Tushar Chande & Stanley Kroll · published as Chande Kroll Stop (volatility form) · The New Technical Trader, 1994 · source Volatility-offset stop lines above and below price, re-smoothed over a second period to cut the flip-flopping.ATR Period 10, ATR Multiplier 1, Stop Period 9 | ||
| 8 | ATR Stop | overlay | By Classical technical analysis A stop a volatility multiple from the close that ratchets in the trade direction and flips when price closes through it.ATR Period 14, Multiplier 3 |
True range and its derivatives9
Nine panes built on the distance a bar actually covered, gap included. This is the practical family: everything used for stop placement and position sizing is here.
| SN | Preview | Indicator | Short name | Draws | What it measures |
|---|---|---|---|---|---|
| 9 | TR | pane | The full distance a single bar covered, counting the gap from the previous close. The building block everything else in this family is made from. | ||
| 10 | ATR | pane | A smoothed average of that distance, and the standard basis for a stop; it tells you how far this stock normally travels in one bar. Period 14 | ||
| 11 | NATR | pane | The same figure as a percentage of price, so a reading means the same thing on a cheap stock and an expensive one, and across a chart whose price has changed by an order of magnitude. Length 14 | ||
| 12 | TR % | pane | By Classical technical analysis The single-bar true range as a percentage of the previous close, lightly smoothed.Smoothing 5 | ||
| 13 | Range % | pane | By Classical technical analysis The plain high-low range as a percentage of the close, smoothed. Unlike the true-range versions it ignores gaps entirely.Smoothing 5 | ||
| 14 | VR | pane | This bar range measured against its own average; above 1 the bar is wider than the stock has been running. ATR Period 14 | ||
| 15 | Range Expansion | pane | By Classical technical analysis The same comparison expressed as an expansion score, where a reading above 1 marks a bar breaking out of its recent size.Period 14 | ||
| 16 | PDIST | pane | The total distance price actually travelled inside a bar, gap included and discounting the part that was pure body. Higher than the true range on a bar that reversed. | ||
| 17 | NextRange | pane | By Classical technical analysis The number behind the Next Day, Week and Month Range bands on the chart. It adds three things and divides by three: the 14-bar average true range, the 14-bar rate of change, and the volume of the bar against its 20-bar average. The three parts are in different units, so the value is not a price. Watch whether it is rising or falling. |
Statistical dispersion6
Six panes that apply ordinary statistics to the closing price, with no reference to the bar range at all.
| SN | Preview | Indicator | Short name | Draws | What it measures |
|---|---|---|---|---|---|
| 18 | StdDev | pane | By Classical statistics How widely closes have scattered around their own mean, in rupees.Period 20 | ||
| 19 | StdErr | pane | That scatter divided by the square root of the window, which measures how uncertain the mean itself is rather than how spread the prices are. Period 20 | ||
| 20 | CV | pane | By Classical statistics The same scatter as a percentage of the mean, so it can be compared between stocks at different price levels.Period 20 | ||
| 21 | HV | pane | By Classical statistics The annualised standard deviation of returns; the number that is meant when anyone says a stock has thirty percent volatility.Period 10 | ||
| 22 | EWMA Vol | pane | An exponentially weighted variance with no window edge, so a shock decays away smoothly instead of dropping out of the calculation all at once. Lambda 0.94, Periods / Year 252 | ||
| 23 | Vol Beta | pane | By Classical technical analysis Recent volatility against the volatility of a window three times longer, which says whether the market is currently rougher than its own baseline.Period 20 |
Ohlc range estimators4
Four panes that get a better volatility estimate out of the same bars by using the high, low and open rather than closes alone. They are listed here in increasing order of how much of the bar they use.
| SN | Preview | Indicator | Short name | Draws | What it measures |
|---|---|---|---|---|---|
| 24 | HL Vol | pane | By Michael Parkinson · published as Parkinson volatility estimator · Journal of Business, 1980 · source An annualised estimate built from the high-low range alone, which extracts far more per bar than a close-to-close figure.Period 20 | ||
| 25 | OHLC Vol | pane | By Mark B. Garman & Michael J. Klass · published as Garman–Klass volatility estimator · Journal of Business, 1980 · source The same idea using all four prices of each bar, which is more efficient again.Period 20 | ||
| 26 | DI Vol | pane | By L. C. G. Rogers & S. E. Satchell · published as Rogers–Satchell volatility estimator · Annals of Applied Probability, 1991 · source An estimator that does not get inflated by a steady trend in the underlying price, which is what the two above do.Period 20 | ||
| 27 | OA Vol | pane | By Dennis Yang & Qiang Zhang · published as Yang–Zhang volatility estimator · Journal of Business, 2000 · source Handles both overnight gaps and intraday drift by combining three separate variances. The most efficient of the four.Length 30, Periods / Year 252 |
Bollinger derivatives2
Two panes that turn what the bands are doing into a number you can compare across dates instead of eyeballing.
| SN | Preview | Indicator | Short name | Draws | What it measures |
|---|---|---|---|---|---|
| 28 | BB Width | pane | How wide the bands are relative to their own middle. A reading at a multi-month low is the squeeze that precedes most range breaks. Period 20, Std Dev 2 | ||
| 29 | %B | pane | Where price sits between the two bands, 0 at the lower and 1 at the upper, so a band touch becomes a value rather than a judgement. Period 20, Std Dev 2 |
Regime and stress gauges6
Six panes that describe what kind of market this is rather than how large its moves are.
| SN | Preview | Indicator | Short name | Draws | What it measures |
|---|---|---|---|---|---|
| 30 | Mass Index | pane | Watches the high-low spread widen and then narrow; the classic reversal warning is a rise above 27 followed by a fall back through 26.5. EMA Period 9, Sum Period 25 | ||
| 31 | UI | pane | How deep and how prolonged the drawdowns from the running high have been, so it measures downside pain rather than two-sided movement. Period 14 | ||
| 32 | RVI (vol) | pane | An RSI computed on volatility instead of price, so it reads on a 0 to 100 scale whether the market is getting rougher or calmer. Smoothing Period 10, StdDev Period 14 | ||
| 33 | THERMO | pane | By Dr. Alexander Elder · published as Elder's Market Thermometer · Trading for a Living, 1993 · source How far the extremes of each bar moved compared with their own average; a reading well above that average marks a market too hot to enter.Length 20 | ||
| 34 | SVIX | pane | How far the low has fallen below the highest recent close. It spikes at capitulation lows the way a real volatility index does, without needing any options data. 5 parameters | ||
| 35 | FDI | pane | By Fractal-dimension literature · no single trading originator How space-filling the recent closes are, from 1 for a straight line to 2 for pure noise. 1.5 is the aimless-drift midpoint: below it the market is trending, above it it is ranging.Length 30 |
The in-house channel1
One overlay written for this app rather than taken from the standard catalogue.
| SN | Preview | Indicator | Short name | Draws | What it measures |
|---|---|---|---|---|---|
| 36 | ka_canal | overlay | By Amrit Shrestha — NChart Pro An in-house channel around price; hugging the top edge is strength, the bottom edge weakness.Length 20 |
What it does not do
- Every entry on this page is backward-looking. High volatility now means volatility has been high, and while it does tend to persist, nothing here forecasts the next shock.
- A volatility spike says nothing about direction. The same reading appears on the day of a limit-up move and the day of a crash.
- Volatility Beta (Simplified) is not a beta against the market. The catalog says so in its own description: there is no benchmark series behind it, so it compares a stock with its own longer-window volatility instead. Do not read it as a beta against NEPSE.
- The annualised estimators assume a fixed number of periods per year, which defaults to 252. On a market with a different number of trading days, or on any intraday timeframe, the absolute figure is off even though the shape of the line is not.
- A stop placed at a volatility multiple can still be wrong. It is sized to the noise, which stops it being hit by noise; it does not make it a good level.
Questions people ask
Bollinger width comes from the scatter of closes, so a series of quiet closes narrows it even if the bars themselves were wide. ATR Channel width comes from the true range, so an overnight gap widens it and a tight close does not narrow it. On a market that gaps regularly, the ATR version reflects the real risk better.
Average True Range on the timeframe you trade, multiplied by two or three. Use Normalized ATR instead if you are comparing several stocks, because a rupee figure is not comparable between them.
They differ in which parts of the bar they use and what they are immune to. High-Low uses only the range, OHLC uses all four prices, Drift-Independent does not get inflated by a trend, and Overnight-Adjusted handles gaps as well. On a calm market their lines nearly overlap; they separate exactly when the market is doing something awkward.
A stretch where volatility has compressed unusually far, which is what Bollinger Band Width at a low reading shows. The squeeze indicators themselves are on the momentum page, because they pair the compression test with a momentum histogram.
The catalog files it under momentum, so it appears on the momentum page. That is where the chart shows it, so that is where this document lists it.