

Momentum & Oscillators
Momentum indicators do not tell you where price is. They tell you how hard it is moving and whether that effort is still increasing, which is a different question and usually the one asked second.
What this page is
Momentum is the largest category in the catalog with 77 entries, and it is the only one in which every single indicator draws in a pane of its own. That is not a styling choice: a momentum reading is a ratio, a percentage or a count, and putting a number that lives between 0 and 100 on the price scale of a rupee 500 stock would flatten it against the bottom of the screen.
Because they are all pane indicators, all 77 have a Calculate on row at the top of their Inputs tab. That is where the stacking happens. Any of them can be computed over the open, high, low, the bar midpoint, the typical price or the four-price average instead of the close, and any of them can be computed over a single-line moving average that is already on your chart.
They fall into eleven families. The RSI family measures gains against losses. The stochastics measure where the close sits inside a recent range. The MACD family measures the gap between two averages. Rate of change measures the plain distance covered. Directional movement grades trend strength. The efficiency gauges ask how straight the path was. One family measures distance from an average, another measures the strength of individual bars, another filters price down to its cycle, and the last is composites and squeezes.
Most of them are far more alike than their names suggest. An RSI, a Net Momentum Oscillator and a Stochastic on the same chart will turn at nearly the same bars. The genuine differences are between families, not within them, which is how this page is arranged.
Why it helps you
- One momentum indicator is enough. Six of them agreeing is one opinion counted six times, and it feels far more like confirmation than it is.
- Divergence is the reading these were built for: price making a higher high while the oscillator makes a lower one. It is a warning that the effort behind the move is fading, not a signal to reverse.
- In a strong trend an oscillator sits pinned at an extreme for days. That is the trend working, not an imminent reversal, which is why a trend reading belongs on the chart before a momentum one.
- The Squeeze entries are the most actionable here, because they answer a question with a yes or a no: is volatility currently coiled, and has it just released.
- Almost nothing here operates at your horizon, with three exceptions. The Long-Term Momentum Curve was designed for monthly data and its turn up from below zero is a genuinely long-cycle signal. Special K sums cycles out to two years. Know Sure Thing blends four horizons at once.
- On a weekly chart the Average Directional Index is worth watching for one thing only: whether a stock has stopped trending. A long position that made sense in a trend is a different position in a range.
- Everything else on this page moves faster than you make decisions. Reading it will mostly manufacture reasons to trade.
When to use it, and where to find it
- After a trend reading, never before one. Whether an overbought oscillator is a warning or a normal feature of a strong move depends entirely on which regime you are in.
- When a move is extending and you want to know whether it is still gaining strength. Momentum peaking before price is the classic early sign of a move running out.
- When price is going sideways and you want to know if anything is building underneath. The Squeeze entries and the efficiency gauges are the ones that answer that.
Try it — a short walkthrough
- 1Filter the catalog to momentumOpen fx and click the momentum chip. It is the largest category, so the counter reads 83 of 276. Every row carries a pane badge; there are no overlays in this category.
- 2Add an RSI and read its bandAdd Relative Strength Index. It opens a pane below the chart with a shaded region across 70 and 30. Hover across the candles and the legend value tracks your cursor.
- 3Move the band to fit the stockOpen the gear and scroll to the Bands section. On a stock that regularly runs to 80 the default 70 marks nothing useful; set the upper level to 80 and the shading moves with it.
- 4Smooth the oscillator instead of lengthening itIn the same dialog, set the Smoothing length to 5. A moving average of the RSI itself is drawn on top of it, in the same pane. Set it back to 0 and that plot disappears entirely.
- 5Compute it over something other than priceAdd a 20 period EMA to the chart, then set the RSI Calculate on row to it. You are now reading the momentum of the average rather than of the candles, which is far steadier and far slower.
- 6Look for divergence rather than for a levelFind a spot where price made a higher high and compare the oscillator peak beside it with the previous one. A lower peak against a higher price is the reading this whole category exists to produce.
Every part, up close
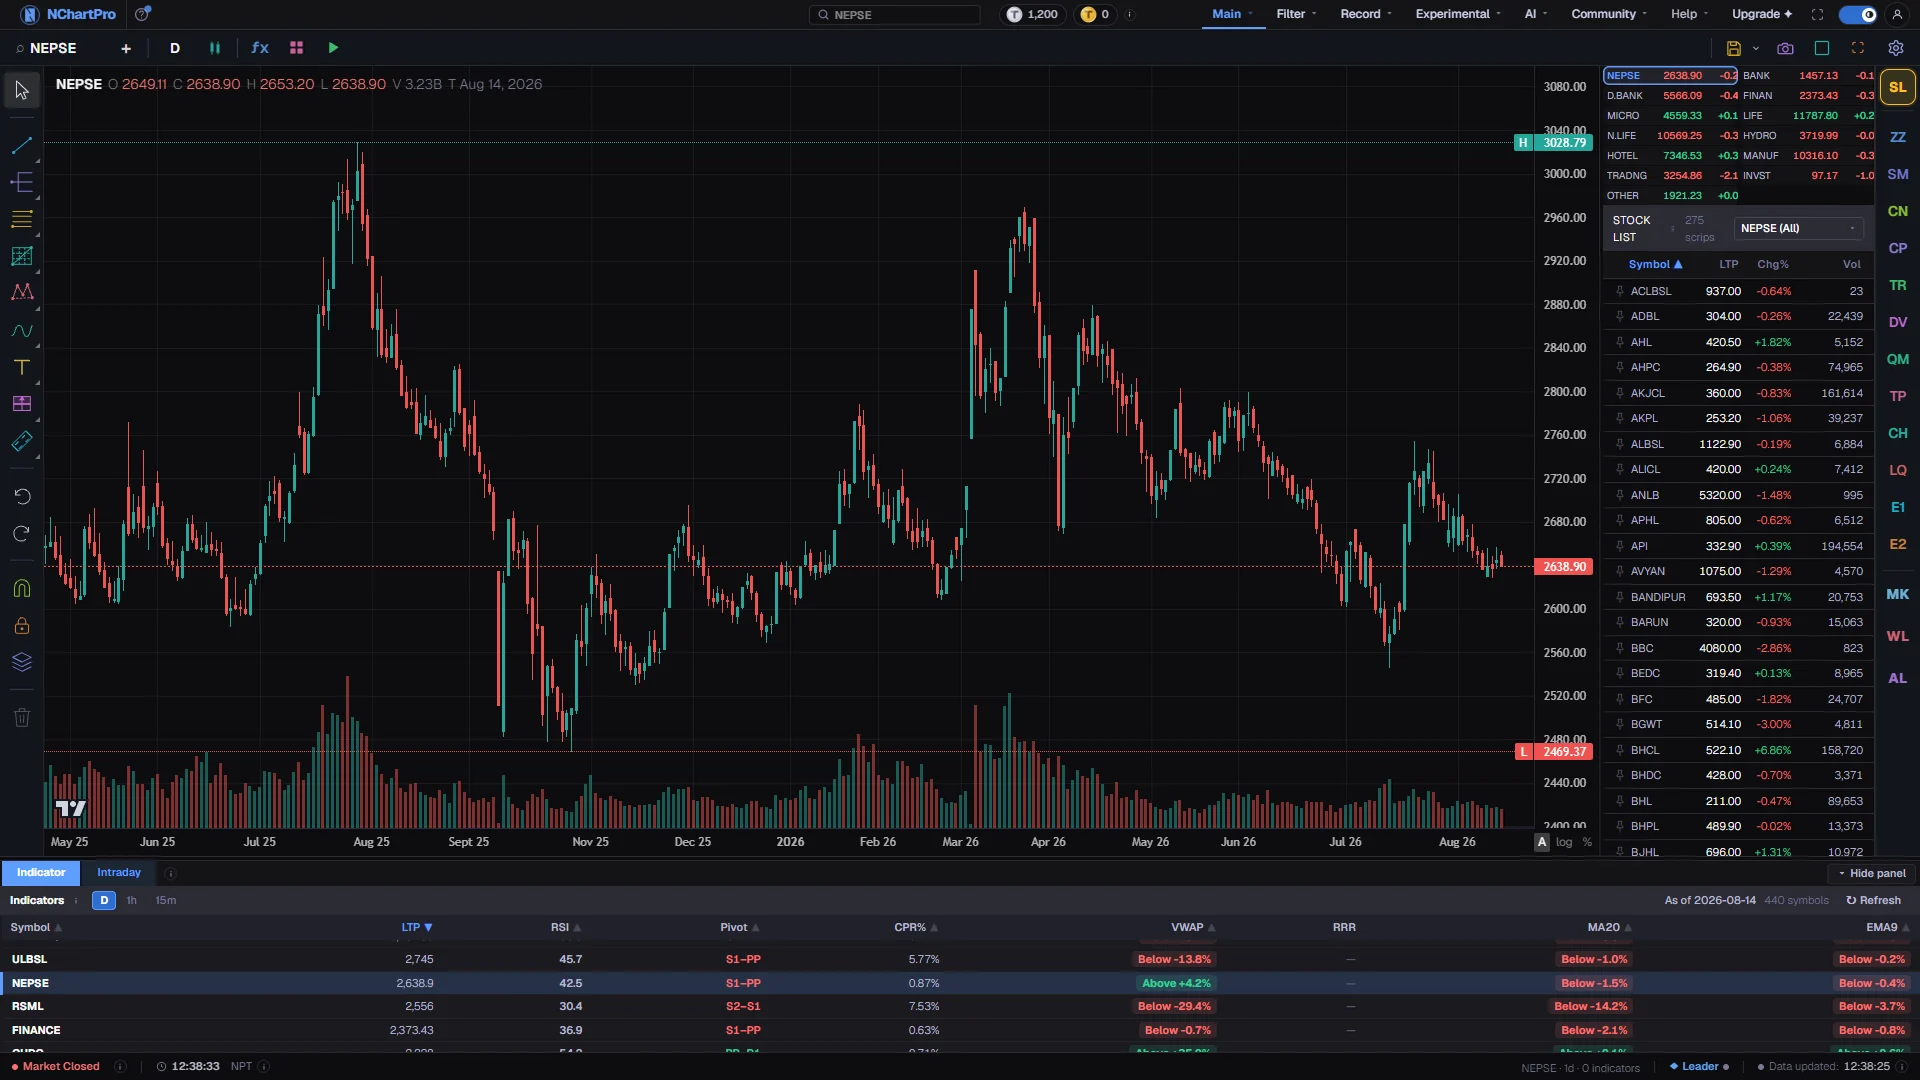
The Chart page — every one of these 77 opens a strip of its own below the price. Each part with a close-up of the real screen; the numbers match the dots on the picture.
The momentum chip
Click momentum in fx and the counter reads 83 of 276, the largest category, with a pane badge on every single row.
The stacked panes
Each one you add opens another strip under the candles with its own vertical scale, because a reading that lives between 0 and 100 cannot share an axis with a rupee price.
Every indicator in this category
Grouped into families, in the order they are explained. Each preview is the indicator computed on real NABIL daily bars by the same engine the chart runs — click one for a full-size picture and a line-by-line description of what it draws.
The RSI family10
Ten entries built on the same idea: compare the size of recent gains with the size of recent losses. All pane indicators, and most carry a shaded overbought and oversold band you can move.
| SN | Preview | Indicator | Short name | Draws | What it measures |
|---|---|---|---|---|---|
| 1 | RSI | pane | Recent gains against recent losses on a 0 to 100 scale, with 70 and 30 as the conventional stretched readings. Period 14 | ||
| 2 | StochRSI | pane | The stochastic formula applied to the RSI itself, so it reaches both extremes far more often than the RSI does. 4 parameters | ||
| 3 | CRSI | pane | By Larry Connors, Cesar Alvarez & Matt Radtke · published as ConnorsRSI · Connors Research, 2014 · source Blends a very short RSI, an RSI of the up-or-down streak length, and where the latest one-bar return ranks in the last hundred.3 parameters | ||
| 4 | RMI | pane | An RSI measured against the close several bars back rather than the previous one, which makes it steadier inside a trend. Period 14, Momentum Period 5 | ||
| 5 | IMI | pane | An RSI built from open to close rather than close to close, so it reads the body of each candle instead of the gaps between them. Period 14 | ||
| 6 | VW-RSI | pane | By Trading community · variant of Wilder's RSI An RSI whose gains and losses are scaled by the volume behind them, so a rally on thin trade counts for less.Period 14 | ||
| 7 | 4S-RSI | pane | By John F. Ehlers · published as Laguerre RSI · Rocket Science for Traders, 2001 · Cybernetic Analysis, 2004 · source An RSI computed over a recursive filter instead of over price; it reaches its extremes far sooner than a 14 period RSI, which is the point of it.Gamma 0.5 | ||
| 8 | QQE | pane | A smoothed RSI with a volatility-scaled trailing stop drawn on it, so a crossing is a considered event rather than the noise a raw RSI cross is. 3 parameters | ||
| 9 | TDI | pane | An RSI with a fast and a slow average of itself for direction, sitting inside bands taken over the RSI for volatility. Trend, momentum and volatility read from one pane. 5 parameters | ||
| 10 | MFI | pane | An RSI weighted by the money that actually changed hands, with the stretched levels conventionally at 80 and 20 rather than 70 and 30. Period 14 |
Stochastics and range oscillators7
Seven entries that ask where the close finished inside the recent high-low range, rather than how big the moves were.
| SN | Preview | Indicator | Short name | Draws | What it measures |
|---|---|---|---|---|---|
| 11 | Stoch | pane | Where the close sits inside the range of the lookback, as a percentage, with a signal line; the crossing near an extreme is the classic read. %K Period 14, %D Period 3 | ||
| 12 | StochF | pane | The same without the slowing stage, so it turns earlier and whipsaws more. Fast %K 5, Fast %D 3, %D MA Type 0 | ||
| 13 | KDJ | pane | The stochastic as it is drawn in Asian markets, with a third J line that deliberately overshoots the 0 to 100 range at an extreme. Length 9, Signal Smoothing 3 | ||
| 14 | SMI | pane | Measures the close against the middle of the range rather than its bottom, so it is centred on zero and considerably less jumpy. Period 14, Smoothing 3, Signal Period 3 | ||
| 15 | %R | pane | The distance of the close below the recent high, on a -100 to 0 scale; the stochastic inverted and unsmoothed. Period 14 | ||
| 16 | DRI | pane | By Thomas R. DeMark · published as DeMarker (DeM) · The New Science of Technical Analysis, 1994 · source Compares new highs against new lows on a 0 to 1 scale, counting only the part of each bar that extended beyond the last.Period 14 | ||
| 17 | PSL | pane | By East Asian charting tradition · no single attributable originator The percentage of the last N bars that closed up. It counts direction only and ignores size entirely, which is what separates it from an RSI.Length 12 |
The MACD family and price oscillators8
Eight entries that subtract a slow average from a fast one and read the gap. Each swings around zero, so they get a bare zero line rather than a shaded band.
| SN | Preview | Indicator | Short name | Draws | What it measures |
|---|---|---|---|---|---|
| 18 | MACD | pane | The gap between a fast and a slow average, with a signal line and a histogram of the difference between the two. 5 parameters | ||
| 19 | MACDEXT | pane | The same with the average type chosen separately for the fast leg, the slow leg and the signal. 6 parameters | ||
| 20 | MACDFIX | pane | MACD with the two lengths locked at 12 and 26, so only the signal smoothing is tunable. Signal Period 9 | ||
| 21 | PPO | pane | MACD stated as a percentage of the slow average, which makes the reading comparable between stocks at very different prices. 3 parameters | ||
| 22 | APO | pane | The gap between a fast and a slow average in rupees, with a selectable average type. Fast Period 12, Slow Period 26, MA Type 0 | ||
| 23 | ImpulseMACD | pane | A zero-lag average measured against a smoothed high-low channel and pinned flat at zero while price sits inside it. The flat stretch is the point: it reads only when the move leaves the range. MA Length 34, Signal Length 9 | ||
| 24 | MAOsc | pane | By Classical technical analysis A fast average minus a slow one in price units, which is the two-average crossover expressed as one line through zero.Fast 10, Slow 20 | ||
| 25 | PVO | pane | By Classical technical analysis The PPO calculation applied to volume, so it shows whether participation is rising or falling rather than price.3 parameters |
Rate of change and raw momentum11
Eleven entries measuring the plain distance covered over a fixed number of bars. The first five differ only in units.
| SN | Preview | Indicator | Short name | Draws | What it measures |
|---|---|---|---|---|---|
| 26 | MOM | pane | By Classical technical analysis The difference between the close now and the close N bars ago, in rupees.Period 10 | ||
| 27 | ROC | pane | By Classical technical analysis The same difference as a percentage, which is the version that compares across stocks.Period 9 | ||
| 28 | ROCP | pane | By Classical technical analysis The same change expressed as a fraction rather than as a percentage.Period 10 | ||
| 29 | ROCR | pane | By Classical technical analysis Price now divided by price N bars ago, so 1.0 means unchanged.Period 10 | ||
| 30 | ROCR100 | pane | By Classical technical analysis The same ratio scaled so 100 means unchanged.Period 10 | ||
| 31 | SROC | pane | A rate of change taken on a smoothed price, which removes most of the single-bar spikes. EMA Smooth 13, ROC Period 21 | ||
| 32 | EMom | pane | The percentage change of a smoothed price against its own value the same distance back. EMA Period 20 | ||
| 33 | KST | pane | Four rates of change over different horizons, smoothed and weighted into one line with a signal; built to show short and long cycles together. 5 parameters | ||
| 34 | LT Momentum | pane | A slow, heavily smoothed momentum reading designed for monthly data, where a turn up from below zero is the classic long-horizon buy. ROC 1 14, ROC 2 11, WMA Period 10 | ||
| 35 | SpecialK | pane | Twelve smoothed rates of change from four bars out to two years, summed into a single line so short, intermediate and long cycles show at once. Period Scale 1 | ||
| 36 | TRIX | pane | The rate of change of a triple-smoothed average, which filters out nearly everything short-term; the zero crossing is the signal. Period 15 |
Directional movement5
Five entries from one system. The Average Directional Index grades trend strength without direction; the four around it are the parts it is assembled from, offered separately.
| SN | Preview | Indicator | Short name | Draws | What it measures |
|---|---|---|---|---|---|
| 37 | ADX | pane | How strong the trend is regardless of which way it points, drawn with the two directional lines that say which way. Above roughly 25 is the usual threshold for trending. Period 14 | ||
| 38 | +DI | pane | The upward half of the directional movement system on its own. Period 14 | ||
| 39 | -DI | pane | The downward half on its own; the two crossing is the direction signal that the Average Directional Index grades. Period 14 | ||
| 40 | +DM | pane | The raw upward movement before it is turned into +DI. Period 14 | ||
| 41 | -DM | pane | The raw downward movement behind -DI. Period 14 |
Trend strength and efficiency7
Seven entries that ask how straight the path was rather than how far it went. They are direction-blind by design, which makes them regime filters rather than signals.
| SN | Preview | Indicator | Short name | Draws | What it measures |
|---|---|---|---|---|---|
| 42 | ER | pane | Net distance travelled divided by total distance covered, from 0 to 1. Near 1 the move is a straight line; near 0 it is churn. Period 10 | ||
| 43 | VHF | pane | The range of the period against the sum of the bar-to-bar moves inside it; rising means trending, falling means ranging. Period 28 | ||
| 44 | RWI | pane | How far the move exceeds what an aimless drift of the same volatility would have produced. Period 14 | ||
| 45 | TII | pane | What share of the recent bars sit above their own average baseline, as a percentage. Period 30 | ||
| 46 | CTI | pane | How closely the last N closes track a straight rising line, from -1 to +1. A pure trendiness measure that says nothing about scale. Length 12 | ||
| 47 | TTF | pane | Compares the buying power of the recent half of the window against the selling power of the older half. Period 15 | ||
| 48 | HiLo | pane | A line that switches between an average of the lows and an average of the highs as price closes through it, giving a simple trend state. Period 10 |
Distance from an average7
Seven entries that measure how far price has stretched from its own centre, which is the mean-reversion question.
| SN | Preview | Indicator | Short name | Draws | What it measures |
|---|---|---|---|---|---|
| 49 | CCI | pane | How far price has strayed from its own statistical mean. Unbounded, but conventionally read at plus and minus 100. Period 20 | ||
| 50 | DPO | pane | By Classical technical analysis Price with the trend of the window subtracted out, leaving the cycle. Useful for measuring the length of a rhythm rather than for signals.Period 20 | ||
| 51 | BIAS | pane | How far price has stretched from its own moving average, as a percentage. The simplest mean-reversion gauge on the page. Length 26 | ||
| 52 | DIX | pane | The same gap measured against an exponential average, so it responds faster than Bias does. Length 14 | ||
| 53 | PGO | pane | The distance of the close from its average divided by typical range, so the stretch is measured in units of volatility rather than rupees. Period 14 | ||
| 54 | FO | pane | The percentage gap between the actual close and what a trailing regression predicted for it. Period 14 | ||
| 55 | PZO | pane | A bounded reading of how one-sided recent closes have been, with plus and minus 40 as the trend thresholds. Length 14 |
Bar strength and pressure7
Seven entries that read the anatomy of individual bars — where the close finished against the open, the range or the volume — rather than the distance between them.
| SN | Preview | Indicator | Short name | Draws | What it measures |
|---|---|---|---|---|---|
| 56 | BOP | pane | Where the close finished relative to the open as a share of the bar range; positive means buyers ended the bar in control. Smoothing 14 | ||
| 57 | Qstick | pane | An average of close minus open, so a persistent run of bullish candle bodies pushes it up. Period 10 | ||
| 58 | RVI | pane | The candle body measured against the candle range and smoothed, with a signal line. It asks whether closes are finishing strong. SMA Period 4 | ||
| 59 | Bull/Bear | pane | How far the high sits above a moving average and how far the low sits below it, plotted as two separate readings. EMA Period 13 | ||
| 60 | FI | pane | Price change multiplied by the volume behind it, which separates a move on real participation from a drift on none. Period 13 | ||
| 61 | AO | pane | The gap between a fast and a slow average of the bar midpoint, drawn as a histogram around zero. Fast Period 5, Slow Period 34 | ||
| 62 | AC | pane | The Awesome Oscillator minus its own average, which is momentum measured a second time and turns before the AO does. Fast Length 5, Slow Length 34, AO Smoothing 5 |
Cycle and filter oscillators5
Five entries that strip price down to its rhythm before measuring anything, so they turn far earlier than a conventional oscillator and are correspondingly less forgiving.
| SN | Preview | Indicator | Short name | Draws | What it measures |
|---|---|---|---|---|---|
| 63 | Cycle | pane | By John F. Ehlers · published as Cyber Cycle · Rocket Science for Traders, 2001 · Cybernetic Analysis, 2004 · source The cyclic part of price once the trend is removed, with a trigger line one bar behind it. Crossings mark cycle turns and the region between the two is shaded to show which side of a turn you are on.3 parameters | ||
| 64 | EBSW | pane | Filtered price normalised by its own power, so it swings roughly between -1 and +1 whatever the instrument. High-Pass Period 40, Smoothing Period 10 | ||
| 65 | CG | pane | The centre of mass of the last N prices, as an offset from the middle of the window. It turns with essentially no lag. Length 10 | ||
| 66 | Roofing | pane | Strips the trend and then the noise, leaving the band of movement most oscillators should be fed instead of raw price. High-Pass Period 48, Low-Pass Period 10 | ||
| 67 | NPT | pane | Reshapes price into a sharper-tailed distribution, which makes turning points stand out more clearly than they do on raw price. Period 10 |
Squeeze and composite readings5
Five entries that combine more than one measurement into a single pane.
| SN | Preview | Indicator | Short name | Draws | What it measures |
|---|---|---|---|---|---|
| 68 | SQZ | pane | A momentum histogram plus a squeeze flag reading 1 while volatility is coiled and 0 when it breaks back out. The flag is a state rather than a price, so read it from the legend; on the histogram scale it sits flat against zero. 4 parameters | ||
| 69 | SQZPRO | pane | The same test graded from 0 to 3 against wide, normal and narrow channels rather than simply on or off. Like the plain squeeze, read the level from the legend. 6 parameters | ||
| 70 | STC | pane | A MACD put through two rounds of stochastic smoothing and clamped to 0 to 100, turning a slow signal into a fast bounded one. Fast EMA 23, Slow EMA 50, Cycle Period 10 | ||
| 71 | WT | pane | A typical price normalised by its own average deviation and then smoothed. Reads like a CCI with far less whipsaw. 3 parameters | ||
| 72 | INERTIA | pane | A volatility index put through a regression. Above 50 the market has upward inertia, below 50 downward. Regression Length 20, RVI Length 14 |
The remaining five5
Entries that do not sit inside any of the families above.
| SN | Preview | Indicator | Short name | Draws | What it measures |
|---|---|---|---|---|---|
| 73 | NMO | pane | By Tushar Chande · published as Chande Momentum Oscillator (CMO) · The New Technical Trader, 1994 · source Up moves minus down moves over their total, on a -100 to +100 scale. An RSI without the smoothing.Period 9 | ||
| 74 | UO | pane | Buying pressure measured over three lookbacks at once and blended, so the reading does not depend on picking a single length. Period 1 7, Period 2 14, Period 3 28 | ||
| 75 | TSI | pane | Double-smoothed momentum against double-smoothed absolute momentum. A very clean line for how one-sided a move has been. Long EMA 25, Short EMA 13 | ||
| 76 | BRAR | pane | By East Asian charting tradition · no single attributable originator Two sentiment ratios from the Chinese markets. One compares the distance above the open with the distance below it; the other does the same against the previous close.Length 26 | ||
| 77 | HLV | pane | By Marc Chaikin · published as Chaikin Volatility · A/D Line, Oscillator and Money Flow — 1970s–80s · source The percentage change of a smoothed high-low spread against its own value N bars ago. The catalog files it under momentum although what it measures is volatility, so look for it here rather than on the volatility page.Period 10 |
The in-house momentum pack5
Five oscillators written for this app rather than taken from the standard catalogue. Four of them are the RSI reworked; the fifth reads the candles themselves.
| SN | Preview | Indicator | Short name | Draws | What it measures |
|---|---|---|---|---|---|
| 78 | e_rsi | pane | By TradingView community script, adapted · based on J. Welles Wilder Jr.'s RSI, 1978 — original script author still being identified An in-house, extra-smoothed version of the RSI bought-too-hard and sold-too-hard gauge.Length 14, Smooth 3, Amp 1 | ||
| 79 | marsi | pane | By Classical technical analysis A smoothed average of the RSI, which makes turns in momentum easier to read.Length 20, MA Type 0 | ||
| 80 | rsi_amp | pane | By TradingView community script, adapted · based on J. Welles Wilder Jr.'s RSI, 1978 — original script author still being identified The same RSI momentum gauge, with its swings magnified so they are easier to see.Period 14, Amp 1 | ||
| 81 | rsi_double | pane | By Classical technical analysis Two RSI momentum gauges together, one fast and one slow, to spot turns early.Fast 7, Slow 14, Smooth 3, Range 100, Amp 1 | ||
| 82 | pait | pane | By Amrit Shrestha — NChart Pro An in-house indicator that scores how each candle behaved, not just where it closed.Period 10 |
Relative rotation1
One entry that measures a stock against a benchmark, not against its own past.
| SN | Preview | Indicator | Short name | Draws | What it measures |
|---|---|---|---|---|---|
| 83 | RS-Ratio | pane | By Julius de Kempenaer (Relative Rotation Graphs), public approximation · RRG Research — the exact JdK formula is unpublished; this is an approximation The two lines of a Relative Rotation Graph, both centred on 100. It must be given a stock price divided by a benchmark price, such as the NEPSE index; on a plain price chart the numbers mean nothing. RS-Ratio above 100 means the stock is doing better than the benchmark. RS-Momentum above 100 means that lead is growing faster than it has been on average lately.4 parameters |
What it does not do
- A momentum indicator cannot tell you what price will do next. It describes the effort behind moves that have already happened, and effort fading is not the same as direction changing.
- Overbought does not mean sell. In a strong trend an oscillator can sit above 70 for weeks while price keeps rising, and acting on the level alone is the most common way this category loses money.
- Divergence fails often. It is a reason to tighten a stop or wait for a second signal, not a reversal trade on its own.
- Several entries are best-effort implementations of indicators whose published formula is ambiguous, and they say so in their own catalog description: Trend Trigger Factor, Random Walk Index, Composite RSI and Exponential Momentum. Treat their shape as meaningful and their exact values as approximate.
- Squeeze Momentum and Squeeze Pro plot a flag rather than a price. On the histogram scale that flag sits flat against zero and looks broken; it is not, and the legend shows its real value.
- High-Low Range Volatility is categorised as momentum in this catalog even though it measures volatility. That is where the catalog puts it, so that is where the chart shows it.
Questions people ask
They answer slightly different questions. RSI compares the size of gains with the size of losses, so it reads the force of a move. The Stochastic asks where the close finished inside the recent range, so it reads position. In a range they will agree most of the time; in a trend the RSI stays stretched while the Stochastic resets more often.
Start with the default and change the timeframe rather than the period. A 14 period RSI covers three and a half hours on a fifteen minute chart and about three trading weeks on a daily one, which is a far bigger change than moving 14 to 21.
Bounded oscillators get the band, and the levels are the conventional ones for that specific indicator: 70 and 30 for the RSI, 80 and 20 for the Money Flow Index. Oscillators that swing around zero get a zero line instead. An oscillator whose thresholds are genuinely a matter of taste is left bare rather than given an invented level.
Not directly, because a source has to be a single-line overlay and an RSI is a pane indicator. What you can do is compute an RSI over a moving average that is on the chart, which is the same idea and is what the Calculate on row is for. Stochastic RSI is the built-in version of this pattern.
They differ only in units — rupees, percentage, fraction, ratio and ratio times a hundred. Which you want depends on what you are comparing against, and having all five means you never have to convert by hand.