

Volatile
A stock that opened low and rose steadily all session is not volatile; one that went up, down and up again is, and only the second kind is listed here.
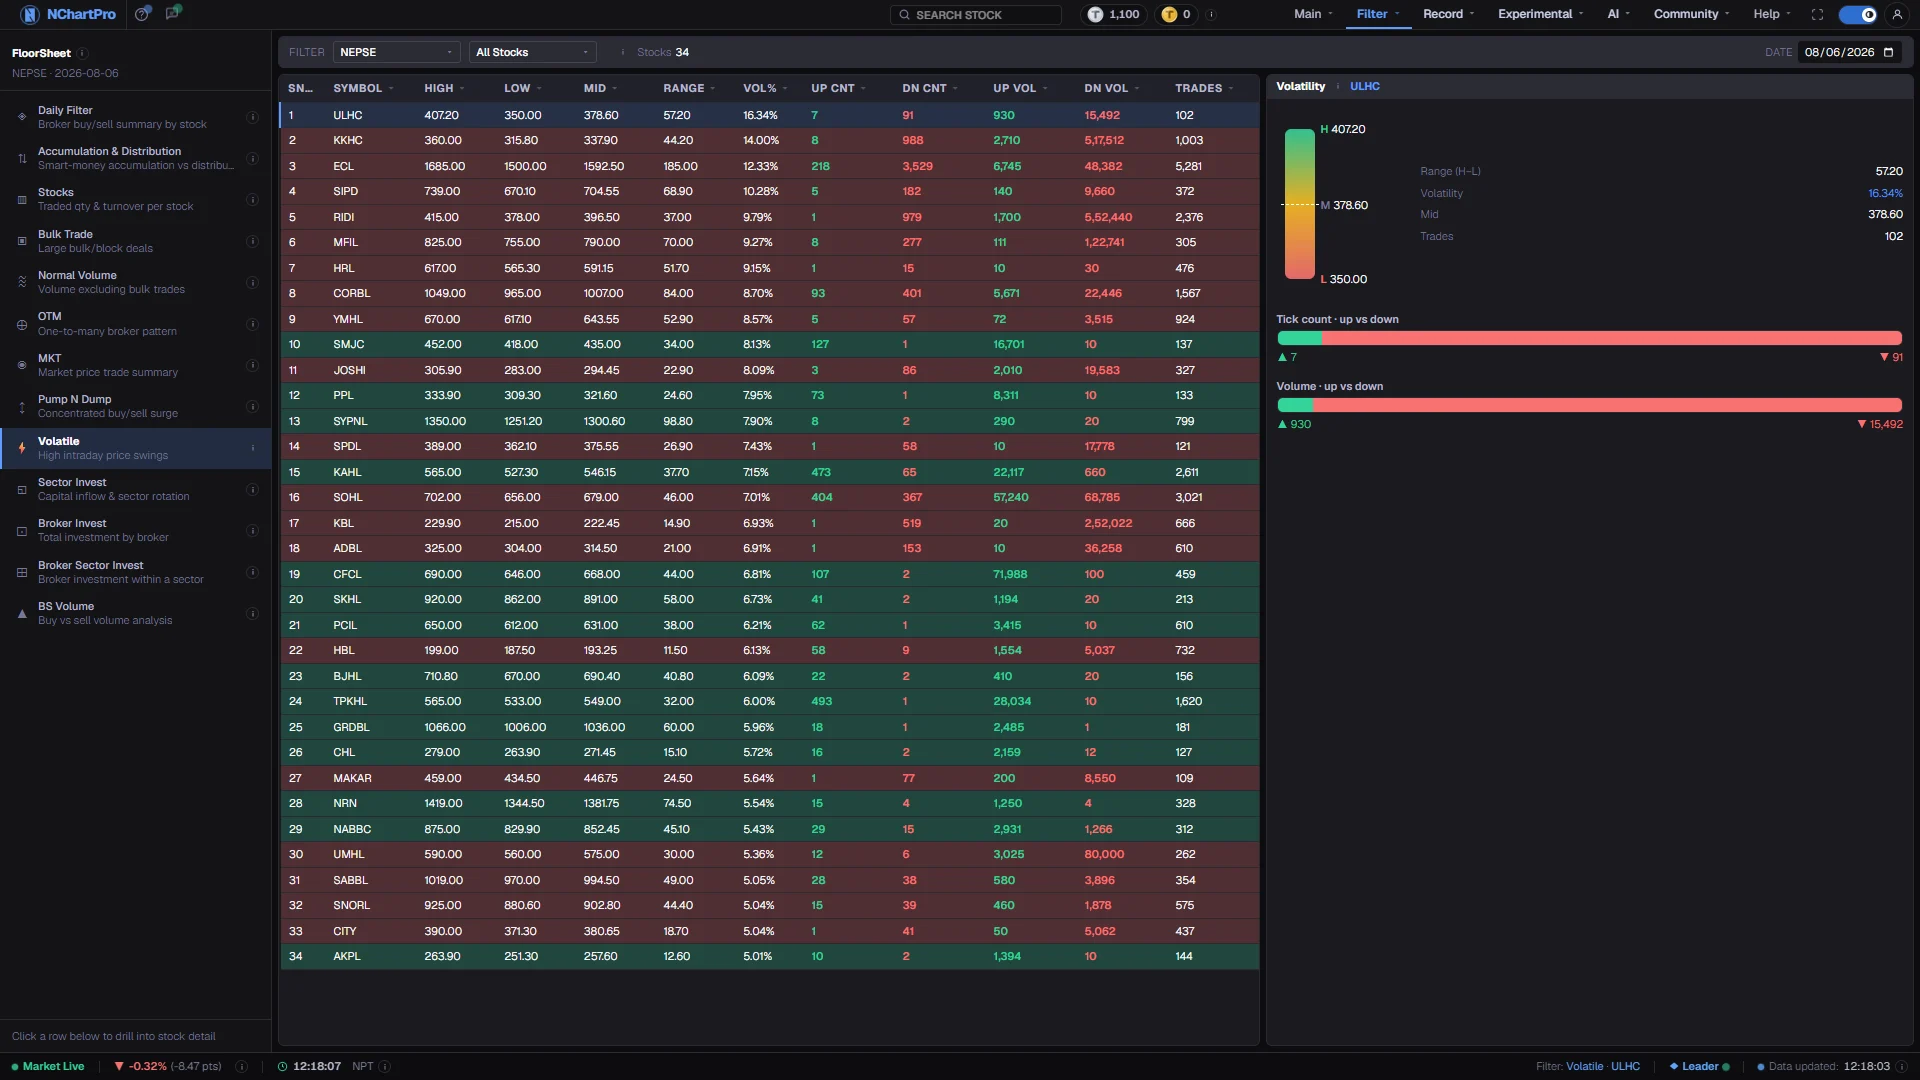
What this page is
Volatile measures movement inside the day, not the day's result. A stock qualifies only if it had at least 100 trades and its range — high minus low, divided by low — was 5% or more. The trade minimum keeps out stocks whose range came from three stray prints.
It then has to prove the swing was traded. A band of ±2% is drawn around Mid, the midpoint of high and low; trades above the band count as up and below it as down, and the stock is kept only if more than five trades landed outside the band on one side.
Why it helps you
- This is the day's opportunity list for anyone trading intraday ranges — wide movement with enough trades at both ends to actually get filled.
- The row tint tells you which side carried the volume, so a wide range with heavy up-volume reads differently from the same range with heavy down-volume.
- Volatility cuts both ways. The wider the range, the larger the gap between the price you see quoted and the price you end up paying.
- Not a page for a long holding. A single volatile session says nothing about a company and should not move a multi-year decision.
- The one thing worth noticing is a stock you own appearing here repeatedly. Persistent wide intraday ranges usually mean a thin book, which matters when you eventually sell.
When to use it, and where to find it
- After the close, when the full set of the day's trades exists — the band test counts trades, so a partial day gives a partial answer.
- Before planning an intraday trade for the next session, to see which names have been ranging.
- When a stock closed nearly flat but you suspect the session was not calm.
Try it — a short walkthrough
- 1Check the entry rulesAt least 100 trades and a range of 5% or more. The count beside the toolbar tells you how many stocks survived those two conditions on this day.See this part in detail →
- 2Understand what kept a stock in the listMore than five trades outside the ±2% band around Mid, on one side. This is what separates a stock that was traded at the extreme from one that merely touched it.See this part in detail →
- 3Sort by Vol% and read the row tintsClick the Vol% heading to bring the widest swings first. Green rows had more up-volume, red rows more down-volume.See this part in detail →
- 4Draw one stock in detailClick a row. The panel on the right redraws that stock alone — the high, mid and low range as a gauge, plus the up and down trade counts and volumes as bars. The page remembers your last pick.See this part in detail →
Every part of the page
In the order you meet them on screen, each with a close-up of the real thing. The numbers match the dots on the figure above.
The floor-sheet filter menu
Every floor-sheet filter has its own page, all listed here. Volatile is the one highlighted.
How — Click any name to jump to that filter. Your sector, stock and date choices carry across.
What has to be true to appear
A stock qualifies only if it had at least 100 trades that day AND its range — (High − Low) ÷ Low — was 5% or more.
How — The sector and stock pickers here narrow the list; the ⓘ repeats the rules, and "Stocks" counts what survived them.
- The 100-trade minimum keeps out stocks whose "range" came from three random trades.
The ±2% band around Mid
Mid = (High + Low) ÷ 2. A band of ±2% is drawn around Mid; trades above the band count as "up", below it as "down". The stock is kept only if more than 5 trades landed outside the band on one side.
How — This is what stops a stock with one freak print from appearing — the swing has to be traded, not just touched.
Reading the columns
High / Low / Mid are intraday trade prices. Range = High − Low. Vol% = (High − Low) ÷ Low as a percentage. Trades = total floor-sheet trades in the stock that day.
How — Click any column heading to sort; sorting by Vol% puts the widest swings first.
- Up Cnt / Dn Cnt = number of trades above / below the band. Up Vol / Dn Vol = the share quantity in those trades.
The row tint
The row colour shows which side carried more volume: green when up-volume was larger, red when down-volume was.
How — Click a row to draw that stock in detail on the right. The page remembers your last pick for the next visit.
The single-stock drawing
The selected row drawn out: the High / Mid / Low range as a gauge, plus the up-versus-down trade count and volume as bars. Only one stock is drawn at a time — that is how this wide per-stock data stays readable.
How — Click another row on the left to redraw it. It uses the row already loaded, so there is no extra wait.
Reading the numbers
- High, Low and Mid are intraday trade prices. Mid = (High + Low) ÷ 2, so it is the middle of the range and not the average traded price.
- Range is High − Low in rupees. Vol% is (High − Low) ÷ Low as a percentage — the same figure the 5% entry rule uses.
- Up Cnt and Dn Cnt are the number of trades above and below the ±2% band. Up Vol and Dn Vol are the share quantity in those trades.
- Trades is the total number of floor-sheet transactions in the stock that day, including the ones inside the band.
- Only one stock is drawn at a time on the right. That is deliberate — this data is too wide per stock to render several at once and stay readable.
- Every column heading sorts, with a dim arrow on inactive columns and an accent arrow on the active one.
What it does not do
- Wide intraday movement is a description of a session, not a forecast of the next one. Nothing here predicts tomorrow.
- The three constants — 100 trades, 5% range, five trades outside a ±2% band — are fixed and unadjusted for the stock's usual behaviour. A name that swings 5% every day appears every day.
- High and low are taken from executed trades on the floor sheet, so a single unusual print can widen the range. The band test limits how much that matters, but does not remove it.
- This page uses prices only, so it carries no broker information and does not depend on the full floor sheet after the close.
Questions people ask
Either it had fewer than 100 trades, or the move was one-directional and the extremes were not traded more than five times outside the band. A steady climb is not volatility as this page defines it.