

Pump N Dump
The name is blunter than the measurement: this counts whether the last stretch of a stock's trading kept stepping in one direction, and nothing more.
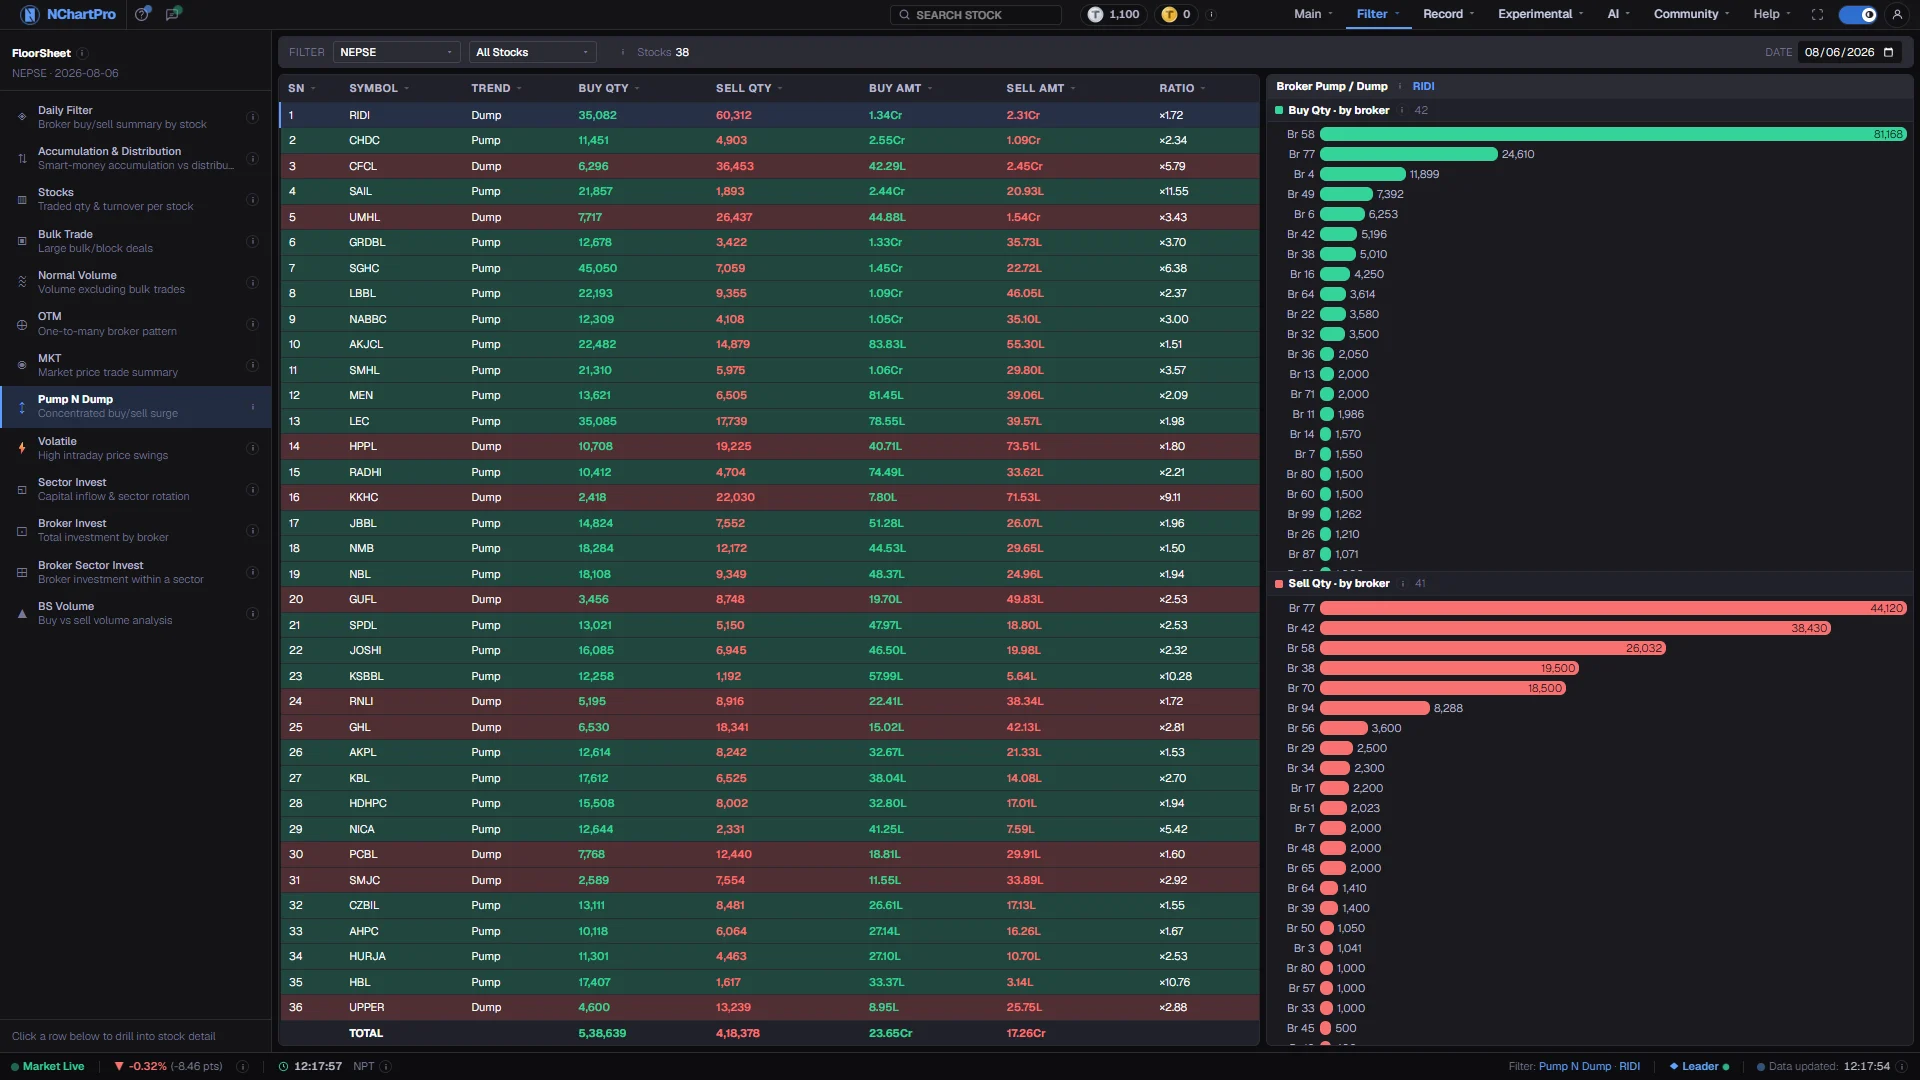
What this page is
Only the last 200 trades of the day are examined, per stock. Each trade is compared with the next one — a higher price than the following trade counts toward buy pressure, a lower one toward sell pressure — and the quantities on each side are added up.
A stock appears only if the two sides together reach at least 10,000 shares and one side is at least 1.5 times the other. Above that, Trend reads Pump when buying dominates and Dump when selling does, and Ratio is the larger side divided by the smaller.
Why it helps you
- Read it as a shortlist for further checking, never as a signal. The right next step is always the stock's ordinary daily volume, which Stocks gives directly.
- The same reading means opposite things depending on size. Heavy one-way pressure on a thin, rarely-traded stock is a caution; the same on a heavily traded large name is usually just momentum.
- The broker panel is worth opening. One firm sitting at the top of both the buyer and the seller list generally means that house was on both sides of many of the same trades.
- Nothing here supports a long-term decision. It measures the tail of one session, on a window of 200 trades, and says nothing about value.
- The one honest use is avoidance: a small stock that keeps appearing with a high Ratio is one where the price you see may not be the price you get.
When to use it, and where to find it
- After the close, once the full day's trades are recorded — the window is the tail of the session, so it is meaningless mid-afternoon.
- When a stock you do not follow appears in a gainers list and you want to know how the move was made.
- Rarely, and with the Stocks page open beside it. The list is short on purpose.
Try it — a short walkthrough
- 1Understand what is being measured firstThe last 200 trades only. Everything on the page is smaller than the stock's full-day figures, and comparing the two directly will mislead you.See this part in detail →
- 2Check why the list is so shortA stock must clear 10,000 shares of combined pressure and be at least 1.5 times lopsided. Most of the market never qualifies, which is the point.See this part in detail →
- 3Sort by Ratio and read the top rowsClick the Ratio heading to bring the most one-sided stocks first. Green rows are Pump, red rows are Dump, and the row tint follows Trend.See this part in detail →
- 4Look up the stock's normal volume before concluding anythingOpen Filter to Stocks for the same date. If the pressure quantity is a large fraction of the stock's usual day, the reading matters; if it is a rounding error, it does not.See this part in detail →
Every part of the page
In the order you meet them on screen, each with a close-up of the real thing. The numbers match the dots on the figure above.
The floor-sheet filter menu
Every floor-sheet filter has its own page, all listed here. Pump N Dump is the one highlighted.
How — Click any name to jump to that filter. Your sector, stock and date choices carry across.
How it is measured
Only the LAST 200 trades of the day per stock are used. Each trade is compared with the next one — a higher price than the next trade counts as buy pressure, a lower one as sell pressure — and the quantities are added up.
How — The ⓘ here repeats the thresholds and column meanings; "Stocks" counts how many names cleared them under your current sector and stock pickers.
- Because only the tail of the day is scanned, these numbers are smaller than the stock's full-day volume.
The thresholds to appear at all
A stock must have buy + sell pressure quantity of at least 10,000 shares, AND one side must be at least 1.5 times the other. Anything quieter than that is left out.
How — That is why the list is short — it is meant to be a "look closer" list, not a ranking of the whole market.
Trend and Ratio
Trend = Pump when buy pressure ÷ sell pressure is above 1.5 (green row); Dump when sell ÷ buy is above 1.5 (red row). Ratio (×) is the bigger side divided by the smaller — ×3.00 means three times as much pressure on the winning side.
How — Click any column heading to sort; sorting by Ratio puts the most lopsided stocks first.
- Buy Qty / Sell Qty are share counts; Buy Amt / Sell Amt are the rupee value of those trades (L = lakh, Cr = crore).
Which brokers were involved
For the stock selected on the left, this shows which broker houses were on each side of the trades that triggered the flag — buyers in green on top, sellers in red below.
How — Click a different stock in the table to redraw both lists.
- Only the last-200-trade window the detector looked at is included, so these totals are smaller than the stock's full-day volume.
- One broker sitting on top of BOTH lists usually means the same firm was on both sides of many of these trades.
How to use it
A pump on a thin, low-volume stock is a common warning sign. The same reading on a heavily traded blue chip is often just normal momentum.
How — Always check the stock's ordinary daily volume before drawing a conclusion — Filter → Stocks gives it directly.
- Treat this page as a shortlist for further checking, never as a buy or sell signal.
Reading the numbers
- Buy Qty and Sell Qty are share counts inside the 200-trade window. Buy Amt and Sell Amt are the rupee value of those same trades, with L for lakh and Cr for crore.
- Ratio is the larger side ÷ the smaller side. A reading of ×3.00 means three times as much pressure on the winning side, not a 300% price move.
- Trend is derived from Ratio and the 1.5 threshold. There is no neutral verdict — a stock below 1.5 does not appear at all.
- The broker bars cover only the same 200-trade window, so their totals are smaller than that stock's full-day broker figures in Daily Filter.
- Every column heading sorts, with a dim arrow on inactive columns and an accent arrow on the active one.
What it does not do
- This page detects pressure. It does not detect manipulation, and it cannot. The word "pump" here labels a direction in a price series, nothing else.
- A stock on this list has not been accused of anything, and neither have the brokers in the panel. Two brokers trading heavily against each other is ordinary market activity and is not evidence of a scheme.
- A trending stock in a strong market produces exactly this pattern honestly, all day, every day. The detector cannot distinguish that from anything else.
- The 200-trade window is arbitrary and fixed. On a very busy stock it covers minutes; on a quiet one it covers the whole session.
- Broker attribution needs the full floor sheet, which arrives after the close. Before it, the broker panel is empty even when the table has rows.
Questions people ask
No. It means the last stretch of its trading leaned heavily one way, above two fixed thresholds. That happens constantly for ordinary reasons, and this page offers no way to tell the ordinary cases apart from anything else.
Because only the last 200 trades are scanned. The rest of the day is not included in any figure on this page.