

Accumulation & Distribution
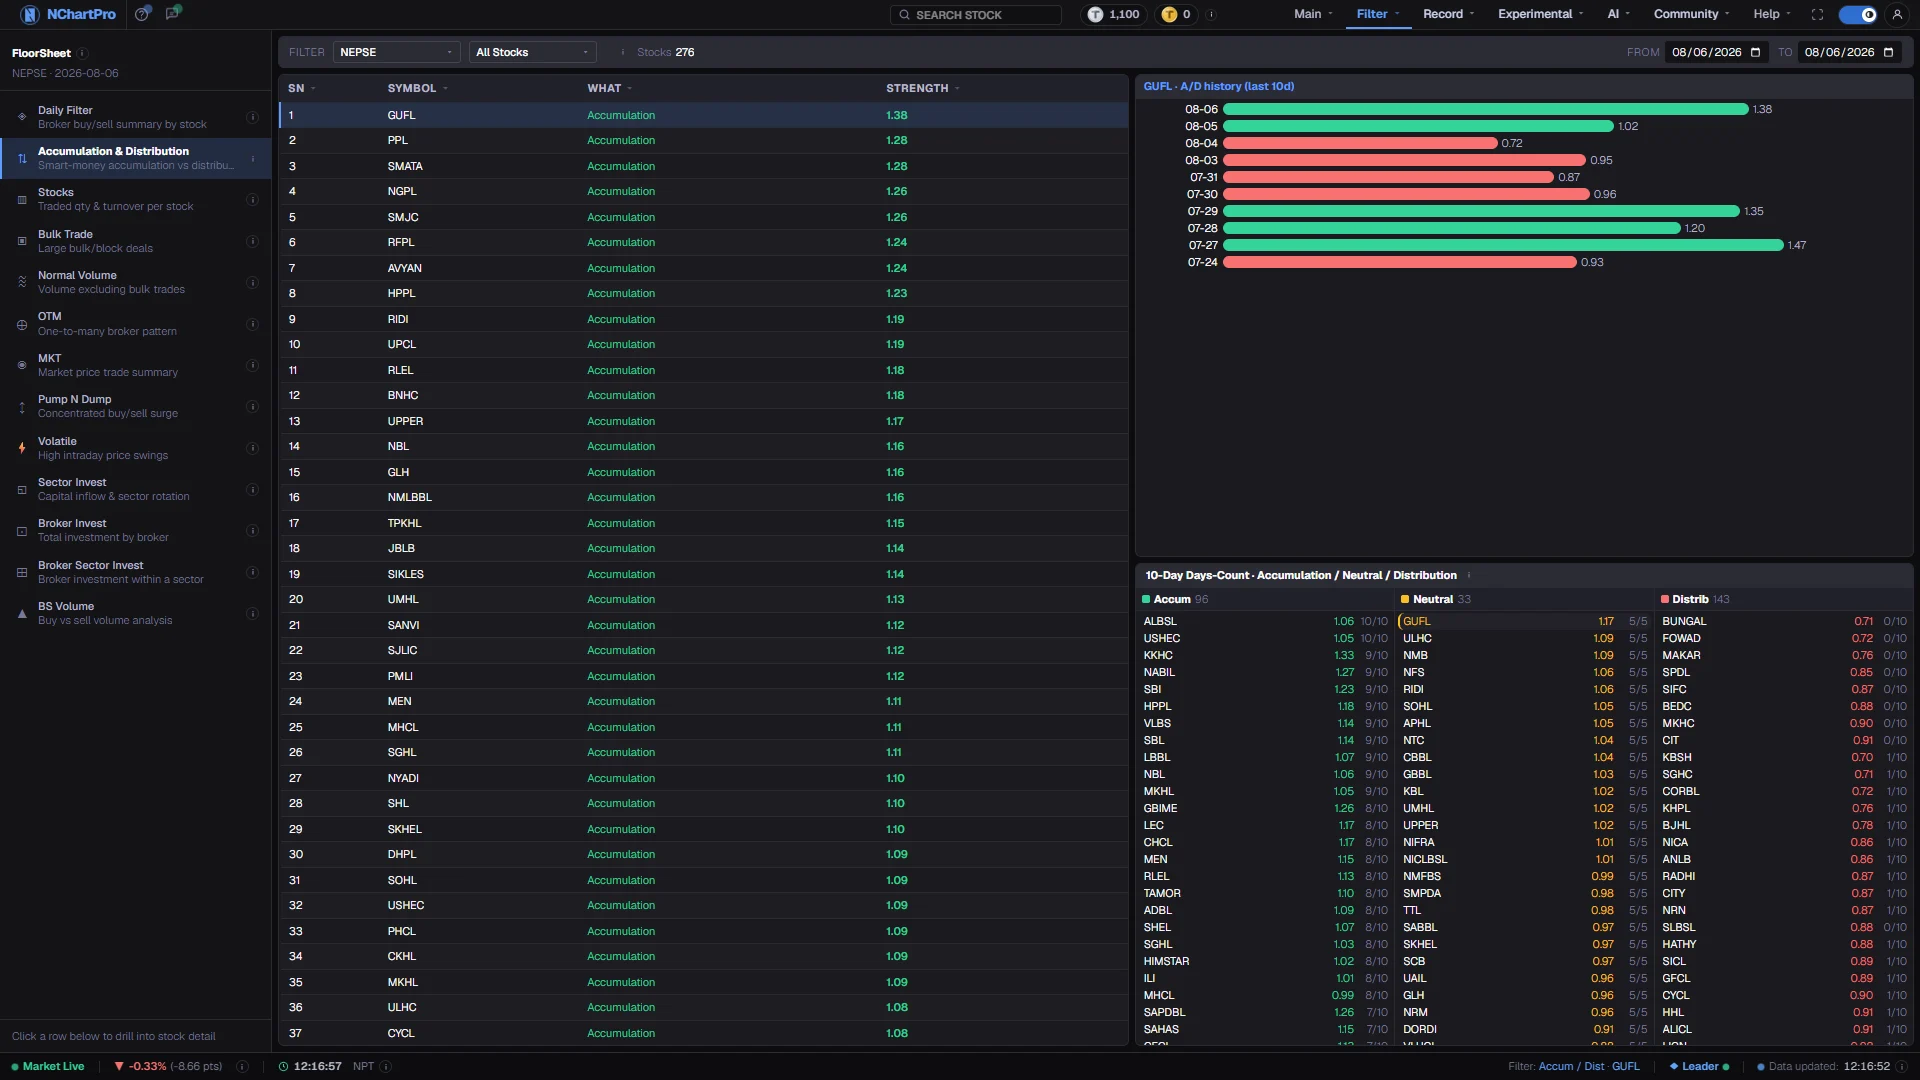
One ratio per stock, built from the ten biggest broker positions on each side of the day, plus ten days of history so you can see whether it held.
What this page is
For every stock the backend adds the ten largest broker buy quantities and the ten largest broker sell quantities of the day. Strength is the first divided by the second. Above 1.00 the biggest hands took in more than they let go, and the verdict reads Accumulation; below 1.00 it reads Distribution. The top-five ratio settles cases that sit near the line.
A single day of that is thin evidence, so the page also carries ten trading days of Strength for whichever stock you select, and three lists that count how many of the last ten days each stock spent on each side.
Why it helps you
- Use it to separate a quiet build-up from a quiet exit. Price alone cannot tell those apart — a stock can drift lower for a week while the largest brokers are net buyers of it every day.
- The ten-day history is the real signal on this page. A run of green bars is a position being assembled; one green bar is a client order.
- Read it against the price chart, not instead of it. Accumulation with a falling price is a different situation from accumulation with a rising one.
- Worth a look before you add to a holding: if the largest brokers have been distributing it for two weeks, waiting costs you little.
- It carries no information about earnings, dividends or the business itself, so it can support the timing of a decision but never the decision.
When to use it, and where to find it
- After the close. The ranking is built only from broker numbers, and these come with the full floor sheet for the day, which is downloaded from a paid market-data feed after the market closes.
- Before adding to or trimming a position, as one input among several.
- Weekly, using the ten-day totals lists, to see which names have been on one side of the ledger consistently.
Try it — a short walkthrough
- 1Set a single completed dayPut the same date in both boxes. Over a range the daily quantities are summed and then classified once — it is not an average of daily ratios, so one very large day cannot be smoothed away.See this part in detail →
- 2Sort by StrengthClick the Strength heading to bring the strongest accumulation to the top, and click again to bring the strongest distribution up instead.See this part in detail →
- 3Open the ten-day history for a nameClick any row. The graph on the right fills with that stock's last ten trading days of Strength, green at or above 1.00 and red below. The page remembers your last pick.See this part in detail →
- 4Cross-check against the totals listsLook for the same symbol in the accumulated-on-more-days list. A stock that appears in both the day's top of the table and the ten-day list is the one worth investigating.See this part in detail →
Every part of the page
In the order you meet them on screen, each with a close-up of the real thing. The numbers match the dots on the figure above.
The floor-sheet filter menu
Every floor-sheet filter has its own page, all listed here. Accumulation & Distribution is the one highlighted.
How — Click any name to jump to that filter. Your sector, stock and date choices carry across.
The formula
For each stock the backend adds up the 10 largest broker BUY quantities and the 10 largest broker SELL quantities of the day. Strength = top-10 buy qty ÷ top-10 sell qty. The top-5 ratio is used to settle mixed cases.
How — The sector and stock pickers here narrow the table; the ⓘ repeats the formula and "Stocks" counts the rows on screen.
From and To
Set both boxes to the same trading day for one day, or open a range.
How — Over a range the daily quantities are summed FIRST and then re-classified — it is not an average of daily ratios.
- That distinction matters: a single huge day cannot be averaged away.
The verdict per stock
SN is the row number, Symbol the stock, What the verdict, Strength the ratio. Strength above 1.00 means Accumulation (green) — big hands bought more than they sold. Below 1.00 means Distribution (red).
How — Click any column heading to sort. Sorting by Strength puts the strongest accumulation (or, reversed, the strongest distribution) at the top.
The 10-day history graph
One bar per trading day for the selected stock — the last 10 trading days of Strength, green when 1.00 or more, red when below.
How — Click any stock in the table to load its history here. The page remembers your last pick, so the graph is already filled the next time you open it.
- A run of green bars is far more meaningful than one green day.
The 10-day totals lists
Three lists covering the last 10 trading days: stocks accumulated on MORE days than they were distributed, stocks distributed on more days, and ties where the two day-counts are equal.
How — Click a stock in any of the three lists to load it into the history graph above.
- These lists count DAYS, not net strength — a stock accumulated on 7 of 10 days sits in the accumulation list.
- Stocks with no accumulation and no distribution days are dropped, since there is nothing to show.
Reading the numbers
- Strength = top-10 broker buy quantity ÷ top-10 broker sell quantity, both in shares (कित्ता). 1.00 is the pivot; there is no neutral band.
- The verdict column is derived from Strength, not measured separately. Green is Accumulation, red is Distribution.
- The three totals lists count DAYS, not net strength. A stock accumulated on seven of the last ten days sits in the accumulation list even if the three distribution days were far larger.
- Stocks with no accumulation days and no distribution days are dropped from the lists rather than shown as zero.
- Every column heading sorts, with a dim arrow on inactive columns and an accent arrow on the active one.
What it does not do
- Accumulation and distribution here are labels for a ratio, not statements about anyone's intent. A broker executes for many clients at once, and the ten largest positions on a side can be ten unrelated orders.
- The measure is deliberately narrow: only the top ten brokers per side count. A stock whose flow was spread evenly across thirty houses gets a Strength near 1.00 whatever actually happened.
- It describes the day that already happened. Nothing on this page forecasts the next one.
- Broker numbers come only with the full floor sheet after the close, so today is not on the page during the session. Some older days were saved without broker numbers, so an old date may be empty.
Questions people ask
No. The verdict compares broker buy quantity with broker sell quantity, not open with close. Large buyers taking stock from a nervous market is exactly what a falling price with rising Strength looks like.
Over a range the quantities are added first and classified once. Averaging the daily ratios would let a single very large day be diluted by several quiet ones.