

Round Trip
Round-Trip is Buy / Sell asked forwards instead of backwards: you name the exit price you are hoping for, and it tells you what that hope is worth after costs.
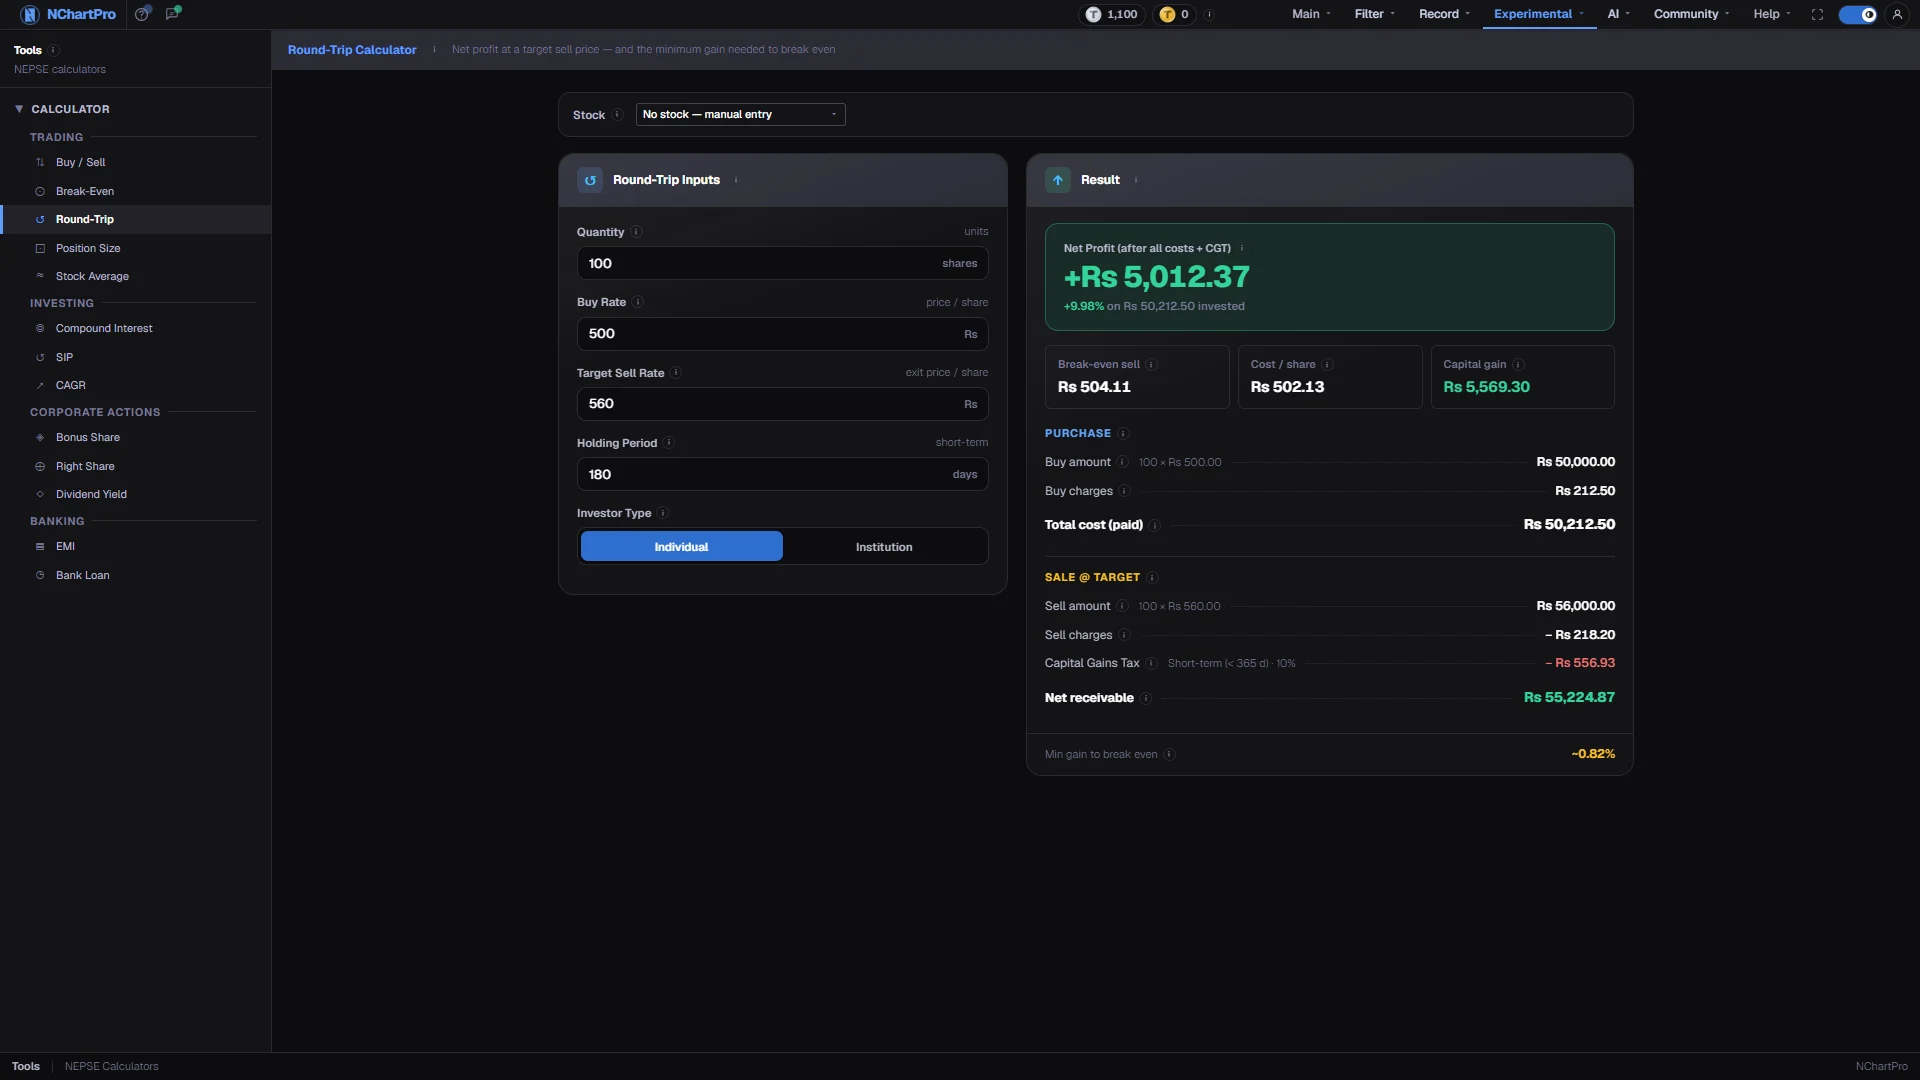
What this page is
A round trip is one complete buy-then-sell cycle. This calculator prices that whole cycle at a target exit price, applying broker commission, the SEBON fee and the DP charge on both legs, plus Capital Gains Tax on any profit.
Its distinctive output is the minimum gain line in the footer: how far the price has to rise, in percent, before the trade is merely flat. On small positions that figure is usually larger than people expect.
Why it helps you
- This is the trade-planning tool. Put your intended target in and see whether the reward justifies the position before you place the order.
- The minimum-gain percentage is a hard filter. If a setup cannot plausibly deliver more than that, it is not a trade regardless of how good the chart looks.
- Of limited use for a long hold, where costs are a rounding error against years of return. If you are here at all, set the holding period past 365 days so the lower tax rate applies.
- Worth one run before a planned exit from a large position, since the commission slab on a big sell amount differs from the one on the original buy.
When to use it, and where to find it
- While planning an entry, to sanity-check the target you have in mind.
- When comparing two possible position sizes for the same idea — the cost drag differs sharply between them.
Try it — a short walkthrough
- 1Describe the planned tradeEnter the quantity and the price you expect to buy at. Use your average cost if you already hold a partial position.See this part in detail →
- 2Try several exit pricesChange the Target Sell Rate and watch the net profit move. This is the fastest way to see how much of a modest gain the charges consume.See this part in detail →
- 3Check the minimum gain in the footerThat percentage is the rise needed just to break even. Compare it against what you actually expect the stock to do.See this part in detail →
Every part of the page
In the order you meet them on screen, each with a close-up of the real thing. The numbers match the dots on the figure above.
Describe the planned trade
Quantity is the shares (kitta) the round trip covers. Buy Rate is what you pay on entry. Holding Period and Investor Type set only the Capital Gains Tax rate.
How — Enter your plan once, then change only the target price in the next step to test different exits.
- Bigger amounts land in a cheaper commission slab: 0.36% up to Rs 50,000, down to 0.24% above Rs 1 crore, minimum Rs 10.
- CGT: individual 10% under 365 days, 7.5% at 365 days or more; institution flat 10%.
Target Sell Rate
The price per share you plan to exit at. This is the one box worth playing with.
How — Try a few values and watch how much of the gain the charges and the tax eat at each one.
- Sell amount = Quantity × Target Sell Rate, before charges and tax.
Net profit at that target
What the whole round trip actually leaves you with, after both legs of charges and the tax.
How — Judge the trade on this figure, not on the price difference.
- Net profit = net receivable on the sell − total cost paid on the buy.
- The % is net profit ÷ total cost paid × 100 — the true return on the money you committed.
Break-even, cost/share, capital gain
Break-even sell is the lowest price that still returns your money in full. Cost / share is what one share truly cost you. Capital gain is the TAXABLE profit, not your take-home profit.
How — Check the target you typed against Break-even sell first — below it the plan loses money whatever the chart says.
- Break-even sell = (total buy cost + Rs 25 DP) ÷ (Quantity × (1 − sell commission rate − 0.015% SEBON)).
- Capital gain zero or negative → no CGT. Losses are never taxed.
Capital Gains Tax line
The tax on your profit, cut by the broker before the money is paid to you. The small label beside it names the rate that was applied.
How — Cross 365 days in the Holding Period box and watch this line drop from 10% to 7.5% of the gain.
- CGT = capital gain × rate, and exactly 0 when there is no gain.
Minimum gain to break even
How far the price must rise, in percent, just to cancel out the charges on both legs. Below this the round trip loses money.
How — Sanity-check your target against it: if your target is only a whisker above this, the trade is barely worth placing.
- Computed as (break-even sell price ÷ Buy Rate − 1) × 100.
- Small trades need a bigger rise, because the flat Rs 25 DP charge and the Rs 10 minimum commission weigh more.
Reading the numbers
- The calculation is the same as Buy / Sell, with the sell rate replaced by your target: buy amount = quantity × buy rate, sell amount = quantity × target sell rate.
- Charges per leg are broker commission (slab rate on that leg's amount, floored at Rs 10) + SEBON 0.015% + a flat Rs 25 DP charge. The slabs are 0.36% up to Rs 50,000, 0.33% to Rs 5 lakh, 0.31% to Rs 20 lakh, 0.27% to Rs 1 crore, 0.24% above.
- Capital gain = (sell amount − sell charges) − total cost paid. CGT = capital gain × rate when positive, otherwise zero. Individual: 10% under 365 days, 7.5% at 365 days or more. Institution: flat 10%.
- Net profit = net receivable − total cost paid.
- Break-even sell = (total buy cost + Rs 25) ÷ (quantity × (1 − sell commission rate − 0.015%)).
- Min gain to break even = (break-even sell ÷ buy rate − 1) × 100. Small trades need a larger rise because the flat Rs 25 per leg and the Rs 10 minimum commission weigh more heavily.
- All rates are hardcoded in the app and should be checked against your broker's current schedule.
What it does not do
- A target price is an assumption, not a forecast. This tells you what a given exit would be worth, never whether the price will reach it.
- Slippage is not modelled. The price you get on the way out is often not the price you aimed at, particularly on thin stocks.
- Broker-specific extras and settlement rounding are not included.