

Position Size
Most people decide the share count from what they can afford. This decides it from what they are willing to lose, which is a different and better question.
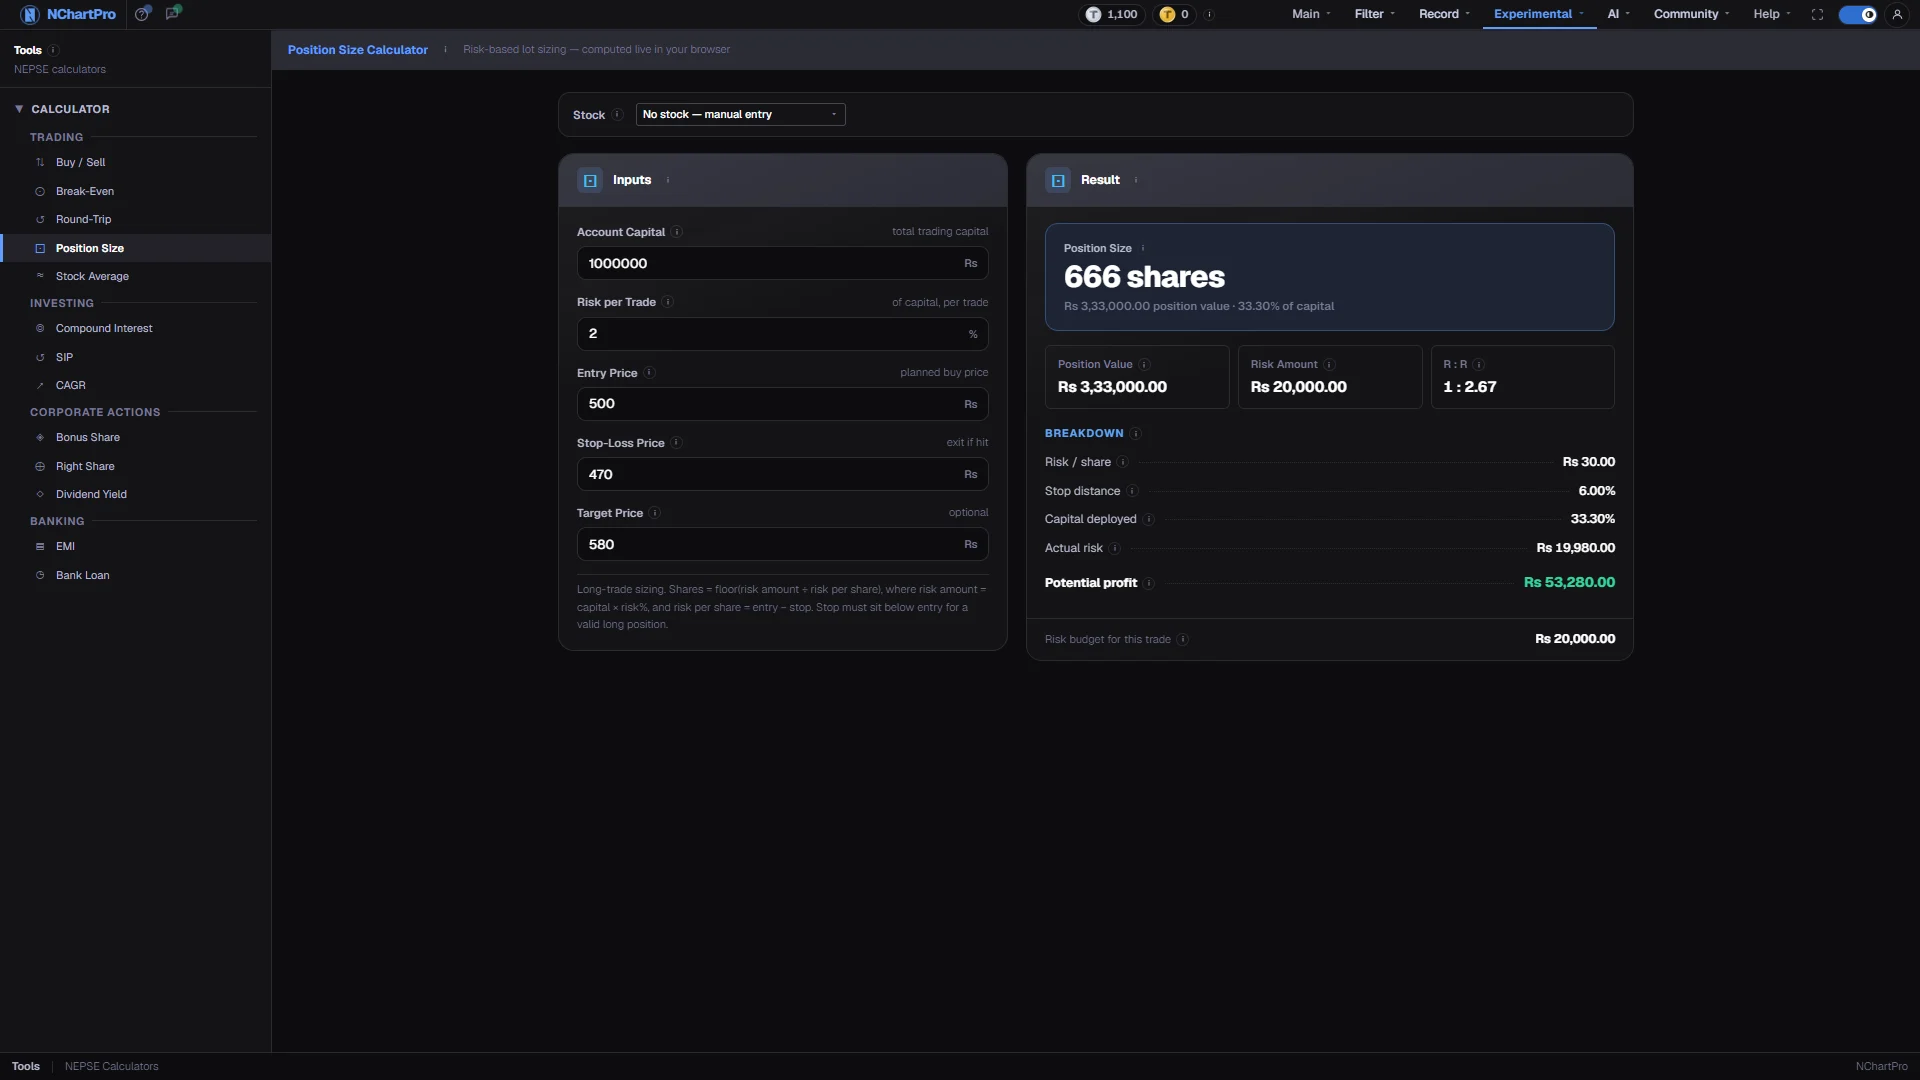
What this page is
You give it your whole trading capital, the percentage of it you accept losing on this one trade, and the three prices of your plan: entry, stop-loss and an optional target. It returns the share count that makes those numbers consistent.
The important distinction on this page is between what you invest and what you risk. Position value is usually many times the risk amount, because the stop-loss sits close to the entry.
Why it helps you
- This is the tool that keeps a losing streak survivable. At 2% risk per trade, ten consecutive losses cost about a fifth of the account rather than ending it.
- The R : R chip tells you whether the plan is worth taking at all. A setup offering less than 1 : 2 needs a very high win rate to make money, which almost nothing has.
- Watch Capital deployed. A very tight stop can size you into more than your whole account — the signal to widen the stop or lower the risk percentage, not to borrow.
- Position sizing by stop-loss does not fit a long-term holding, where there is no stop and the thesis is measured in years rather than rupees.
- The one line worth borrowing is Capital deployed: it tells you what share of your account a single company would represent, which is a concentration question every investor should ask.
When to use it, and where to find it
- Before every trade you intend to run with a stop-loss.
- When a setup looks attractive but the stop is far away, to see how small the position has to become.
Try it — a short walkthrough
- 1Set your capital and your riskEnter your whole trading account, not just what you plan to put in this stock, then the percentage of it you accept losing. Most disciplined traders use 1% to 2%.See this part in detail →
- 2Enter entry and stop-lossThe stop must sit below the entry for a long position. If it does not, the result reads 0 shares, because there is no defined risk to size against.See this part in detail →
- 3Check Actual risk against the budgetRounding the share count down means the real loss at the stop is slightly under your budget. If Actual risk ever turns red it has exceeded it.See this part in detail →
Every part of the page
In the order you meet them on screen, each with a close-up of the real thing. The numbers match the dots on the figure above.
Capital and entry
Account Capital is the total money in your whole trading account — not just what you plan to put into this one stock. Entry Price is the price you plan to buy at.
How — Enter your real account size; the risk budget is worked out from it, so a made-up number gives a made-up share count.
- Account Capital is used only to compute the rupee risk budget: capital × risk %.
Risk per Trade
What percent of your whole account you accept losing if this trade goes wrong. Most disciplined traders keep it between 1% and 2%.
How — Change it and watch both the share count and the rupee risk budget move together.
- Risk amount = Account Capital × this % ÷ 100.
- At 2% of Rs 10,00,000 you are RISKING Rs 20,000 — that is not the same as investing only Rs 20,000.
Stop-Loss Price
The price at which you admit the trade failed and sell. It must be BELOW the entry price, otherwise there is no defined risk and the result shows 0 shares.
How — Move it closer to entry and the share count rises; move it further away and it falls.
- Risk per share = Entry Price − Stop-Loss Price.
- A very tight stop is easily triggered by normal daily noise, even though it lets you buy more.
Target Price (optional)
The price you aim to sell at for a profit. It is used only for the Risk : Reward ratio and the potential-profit line — it does not change the share count.
How — Leave it blank if you have no target; the R : R chip then shows a dash.
- Reward per share = Target Price − Entry Price. It is ignored if it is not above the entry price.
Position Size
The number of shares to buy. Buy this many and a stop-loss exit costs you roughly your risk budget — no more.
How — Read the line underneath: it gives the rupee position value and what share of your capital that ties up.
- Shares = risk amount ÷ risk per share, rounded DOWN to a whole share.
- It shows 0 when the stop-loss is not below the entry price, because there is then no defined risk.
Value, risk and R : R
Position Value is what you INVEST — usually far larger than what you RISK. Risk Amount is the rupee loss you accepted. R : R compares the reward you aim for with that risk.
How — Keep the two apart in your head: investing Rs 3,00,000 while risking Rs 20,000 is normal, not a contradiction.
- Position value = shares × Entry Price · R : R = (Target − Entry) ÷ (Entry − Stop).
- "1 : 2" means you aim to make Rs 2 for every Rs 1 risked. Above 1 : 2 is generally considered a healthy plan.
Actual risk — the check
The real rupee loss at the stop-loss once the share count is rounded down to a whole number. It should sit just under your risk budget.
How — If it ever turns red it has exceeded the budget — lower the risk % or widen the stop.
- Actual risk = shares × risk per share.
- Also watch "Capital deployed": it can exceed 100% when the stop is very tight, which would mean borrowing.
Reading the numbers
- Risk amount = account capital × risk per trade % ÷ 100.
- Risk per share = entry price − stop-loss price. It must be positive; long trades only.
- Shares to buy = floor(risk amount ÷ risk per share).
- Position value = shares × entry price. Capital deployed % = position value ÷ account capital × 100.
- Stop distance % = (entry − stop) ÷ entry × 100. Actual risk = shares × risk per share.
- R : R = (target price − entry price) ÷ (entry price − stop-loss price), and shows a dash unless the target sits above the entry. Potential profit = shares × (target − entry).
- Broker commission, the SEBON fee, the DP charge and Capital Gains Tax are NOT applied here. Every figure on this page is a raw price calculation — take the resulting trade to Buy / Sell for the real settlement.
- Ceilings: capital is capped at Rs 10 crore, risk per trade at 100%, and any price at Rs 99,999 when no stock is selected.
What it does not do
- A stop-loss is a plan, not a guarantee. NEPSE gaps and circuit limits can take a price past your stop before you exit, so the actual loss can exceed the budget.
- Charges are excluded, so the true loss at the stop is a little larger than Actual risk suggests.
- Short positions are not supported. A stop above the entry produces 0 shares rather than a short-side size.
- The share count assumes you can fill the whole quantity at the entry price. In a thin stock you cannot.