

Paper Trading
When to use it, and where to find it
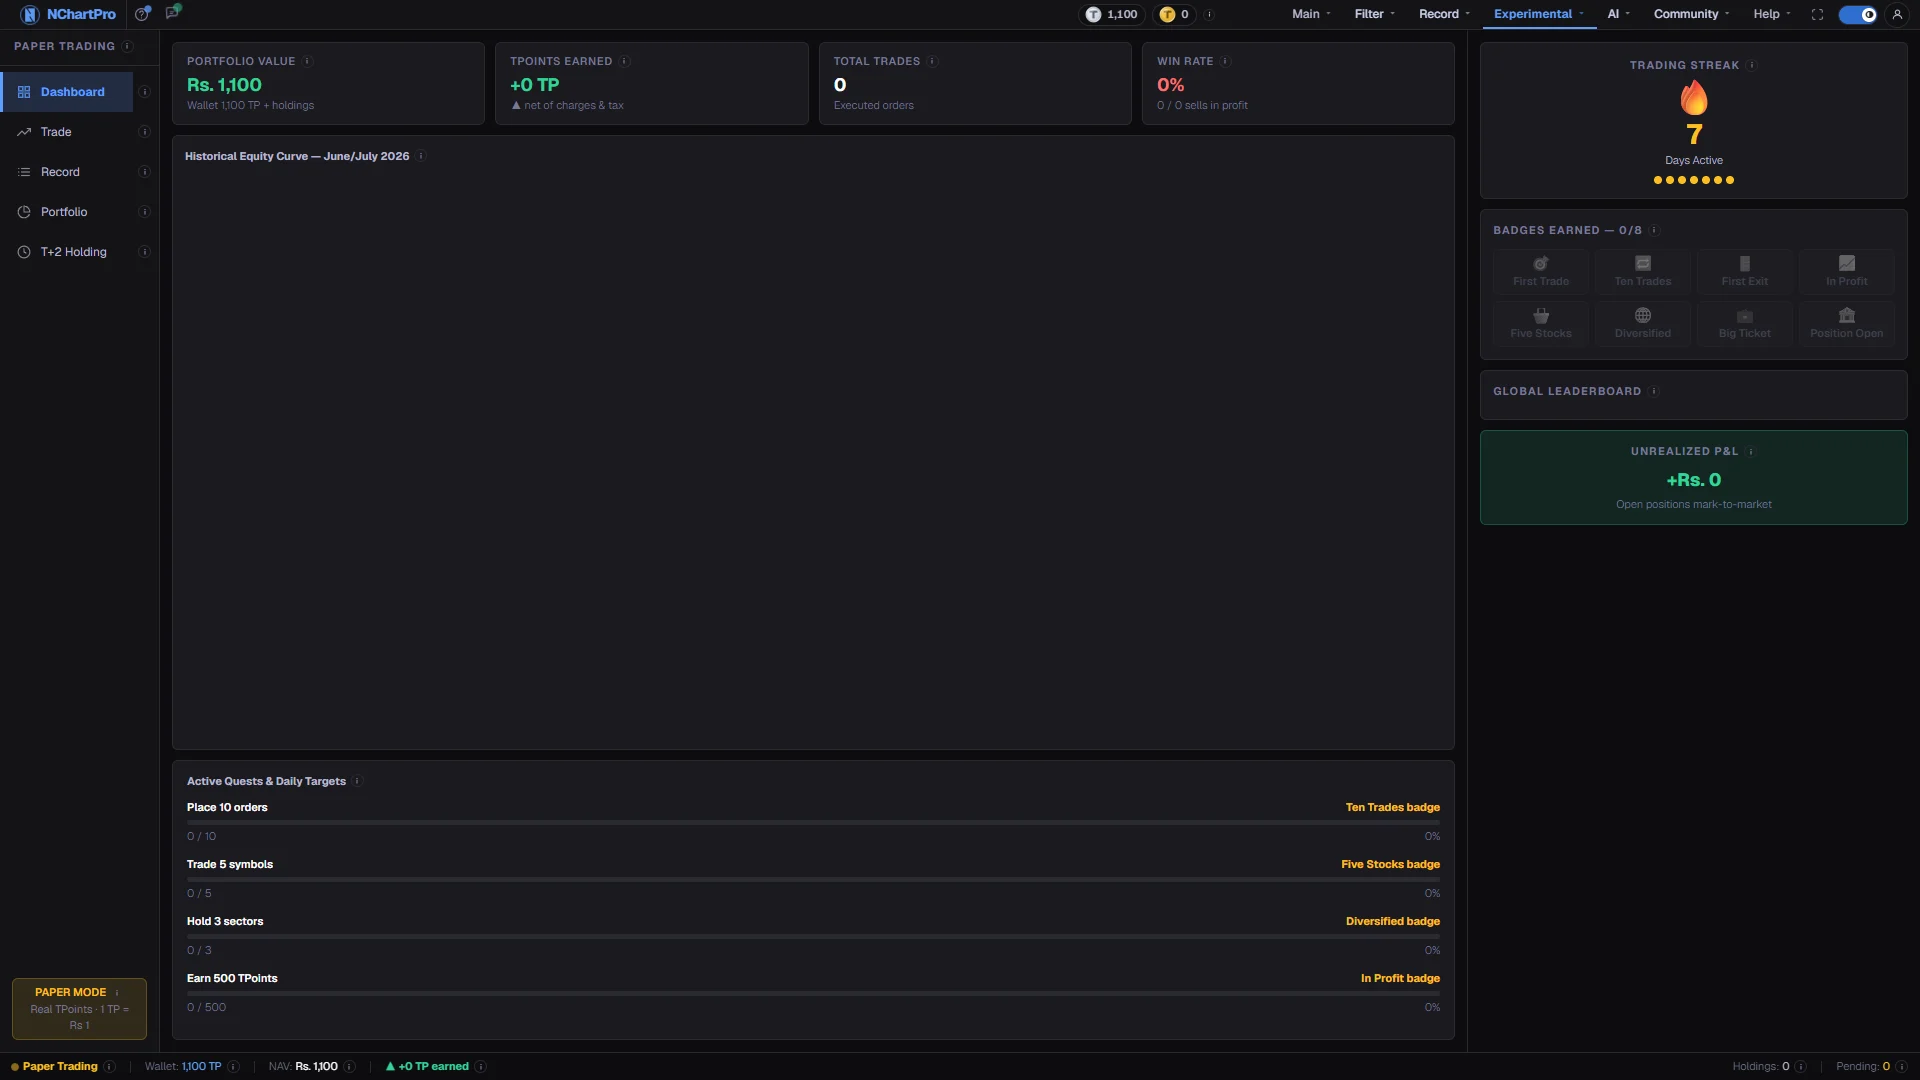
Every part of the page
In the order you meet them on screen, each with a close-up of the real thing. The numbers match the dots on the figure above.
The five views
Dashboard is the scoreboard. Trade is where you place an order. Record is the log of every order. Portfolio is what you currently hold. T+2 Holding is shares bought but not yet settled.
How — Click any name to switch. Each one has its own ⓘ beside it explaining that view in a sentence.
- T+2 exists because in NEPSE shares reach your demat account 2 business days after the trade; this module mirrors that delay.
- Any ordinary company share in the 12 NEPSE sectors can be traded here — mutual funds, debentures, promoter shares and the index itself are refused.
The four headline numbers
Portfolio Value is cash left plus every holding priced at its latest rate. Overall Return compares that with the Rs 2,00,000 starting capital. Total Trades counts filled orders. Win Rate is the share of your sells made above that stock's previous close.
- Overall Return = (portfolio value − Rs 2,00,000) ÷ Rs 2,00,000 × 100.
- Win Rate measures the sell price against the stock's previous close — NOT against your own buy price, so it is not the same as "trades that made me money".
- Cancelled and still-pending orders are not counted in Total Trades.
Equity curve
A day-by-day line of what the practice account was worth. Each point is cash plus holdings valued at that day's price, so a rising line means the account grew and a dip is a drawdown.
- Each point is a real snapshot of YOUR account, written once a day by the 5 PM scan, so the line only starts filling in after your first full day of trading.
Streak, badges and leaderboard
The encouragement column: a daily-activity streak, badges for firsts like your first trade, a global ranking by return, and an Unrealized P&L box for profit that exists only while you still hold the shares.
- Unrealized P&L = (quantity × latest price) − (quantity × your average cost), added up over every holding. It becomes real only when you sell.
- These rewards are cosmetic and have no money value.
- The leaderboard is real — it ranks accounts that have actually traded, by their return on the opening capital. Badges are worked out from your own trading record. The streak, however, is still a fixed 7 days and is NOT counted from your activity.
Account strip at the bottom
Always-visible account state: Cash you can still buy with, NAV (the whole account's worth), overall return, how many stocks you hold, and pending orders.
- Cash falls by (quantity × rate + charges) on a buy and rises by the net proceeds on a sell.
- Pending is normally 0 because orders here fill instantly at the price shown.
PAPER MODE — and the charges
The reminder that every rupee here is simulated. What IS real is the fee maths: the module bills a buy or sell exactly the way NEPSE does.
- Broker commission runs by slab from 0.36% on small bills down to 0.24% on the largest, never below Rs 10.
- Plus SEBON 0.015% of the bill and a flat DP charge of Rs 25.
- A profitable sell is also charged 10% Capital Gains Tax on the gain (the rate for a holding of 365 days or less).