

Risk Analysis
Risk here is not a warning. It measures how much your portfolio value moves about, and how much of the outcome depends on a small number of stocks.
What this page is
Risk Analysis describes the shape of your portfolio rather than judging it. A low score is not automatically better — it usually means slower growth as well. What the page is for is knowing which kind of risk you are carrying, so a fall does not surprise you.
Two different kinds of number sit on the same screen. The Concentration card is recalculated live from your current holdings, so it always has real values. Volatility, beta, Sharpe, Sortino, drawdown and VaR are read from a stored risk-metrics record and show a dash until that record has been computed for your account.
Everything is scoped to the portfolio named in the sidebar. Splitting money between two portfolios does not reduce the risk measured inside either one, and a stock held in both is measured separately in each.
Why it helps you
- Concentration is the number you can act on today. A single stock over 20 percent carries a warning marker, and on a fast-moving name that one position decides your week regardless of how well the rest is placed.
- VaR gives your downside a rupee figure for one trading day. Set it against the cash you can actually afford to see move, because NEPSE has no automatic stop-loss — every exit is a manual order you have to place in time.
- Beta tells you how much of your daily movement is simply the market. A beta near 1.5 means most of your good days were NEPSE having a good day, and your losing days will be 50 percent worse than the index too.
- Max Drawdown is the honest question for a long holder: could you have sat through that fall without selling? Recovering is harder than falling, since a 50 percent drawdown needs a 100 percent gain just to return to level.
- The Sector Herfindahl Index is where sector concentration shows up. Nepali retail portfolios drift towards banking and hydropower, and one index value tells you how far yours has drifted.
- Sharpe and Sortino compare what you earned against the NRB 91-day treasury-bill yield. If a long-held portfolio is not clearly beating the risk-free rate per unit of risk, a fixed deposit was doing the same job with none of the worry.
When to use it, and where to find it
- After a large buy, to see what it did to your top-3 weight before the position grows further.
- During a market fall, to check whether the fall is inside the range this page already told you to expect.
- At a monthly or quarterly review, alongside Performance — that page says what happened, this one says how much risk produced it.
- Before adding to a name that is already your biggest holding.
Try it — a short walkthrough
- 1Read the headline, then ignore itNote the 0–10 gauge and its Low / Medium / High band, then move straight to the breakdown. The single score does not tell you which risk you are carrying.See this part in detail →
- 2Find your longest barIn Risk Component Breakdown, the longest of the four bars is the one driving your score. Concentration is the only one you can fix by trading; volatility and beta are properties of the stocks you chose.See this part in detail →
- 3Check whether the swing is being paid forRead Portfolio Volatility next to Sharpe and Sortino. High volatility is only a problem when the return does not repay it — above 1.0 on Sharpe is generally taken as reasonable.See this part in detail →
- 4Size your own tolerance against a bad dayTake the 95% VaR figure as a routine bad day and 99% as the rare harsh one, then ask whether you could absorb that rupee amount without selling in a panic.See this part in detail →
- 5Look for the warning markersScan the Top Holdings list in Concentration Analysis for a warning marker — it flags anything above 20 percent in one stock, the level at which a single announcement moves your whole portfolio.See this part in detail →
- 6Do something about the largest oneConcentration is fixed by trimming or by adding elsewhere, not by watching. Suggestions turns these same thresholds into plain prompts, and Overview shows the split behind them.See this part in detail →
Every part of the page
In the order you meet them on screen, each with a close-up of the real thing. The numbers match the dots on the figure above.
Whose risk you are reading
Every score on this page belongs to the portfolio named here. Splitting your money across two portfolios does not lower the risk measured inside either one.
How — Click the box to switch portfolio; the score, breakdown and concentration all reload.
- There is no combined risk view across portfolios, so a stock held in two of them is measured separately in each.
Overall Risk Score
A single 0–10 summary of how risky this portfolio is, shown on a gauge with Low / Med / High marked underneath.
How — Use it as a headline only — the breakdown beside it tells you WHICH kind of risk is driving the number.
- It is the composite score stored with your latest risk-metrics record, blending volatility, concentration and drawdown.
- Under 4 = Low, 4 to under 7 = Medium, 7 and above = High.
- It shows 0.0 until a risk-metrics record exists for your account, even though the concentration card further down is already live.
Risk Component Breakdown
The four separate things that make a portfolio risky, each scored 0–10, so you can see which one is driving your overall score. A longer bar is more risk.
How — Fix the longest bar first. Concentration is the one you can act on immediately; volatility and beta are properties of the stocks you chose.
- Concentration Risk = your top 3 holdings' share of the portfolio ÷ 10, so a top-3 of 100% scores 10.
- Volatility Risk = annualised volatility ÷ 3, so a 30% swing scores 10. Market (Beta) Risk = beta × 5, so beta 2.0 scores 10.
- Drawdown Risk = |max drawdown %| ÷ 4, so a −40% fall scores 10.
- Every score is capped at 10. Green under 4, amber 4–7, red above 7.
Volatility Metrics
How much your portfolio bounces around, and whether the return you are getting justifies that bouncing. All six values are read from your stored risk-metrics record.
How — Read Sharpe and Sortino together with Volatility: high volatility is only a problem if the return does not pay for it.
- Portfolio Volatility (Ann.) is the typical yearly swing as a %. 15% means a normal year sees you roughly 15% up or down along the way.
- Beta vs NEPSE is how you move relative to the index: 1.0 = in step, 1.5 = you swing 50% harder, 0.5 = calmer than the market.
- Sharpe Ratio is return earned per unit of total risk taken — above 1.0 is generally considered good. Sortino is the same idea but counts only DOWNWARD swings as risk.
- The Risk-Free Rate is the NRB 91-day treasury-bill yield — the "safe" return your portfolio is compared against in Sharpe and Sortino.
Drawdown Analysis
A "drawdown" is how far your portfolio fell from a previous high point before recovering. Max Drawdown is the deepest such fall you have lived through.
How — Use it to size your own tolerance: recovering is harder than falling — a −50% drawdown needs a +100% gain just to get back to level.
- Max Drawdown % is read from your stored risk-metrics record and shows "—" until it has been computed.
- The bar shape below the number is ILLUSTRATIVE. It is drawn to your real max-drawdown depth to show the scale, but it does NOT plot your actual day-by-day history.
Value at Risk (VaR)
VaR answers one question: "on a bad day, how much could I lose?" It puts a rupee figure on your downside for a single trading day.
How — Read 95% VaR as the routine bad day and 99% VaR as the rare harsh one, then ask whether you could absorb that amount without selling in a panic.
- 95% VaR — on the worst 1 day out of 20, you could lose about this much or more. 99% VaR — the worst 1 day in 100.
- It is NOT a maximum. A truly bad day can exceed it — that is exactly what the remaining 5% (or 1%) of days means.
- Both figures come from your stored risk-metrics record and show "—" until it has been computed for your account.
Concentration Analysis
Whether your money is spread out or piled into a few names. Unlike everything above, this card is recalculated LIVE from your current holdings, so it always has real numbers.
How — Look for a ⚠ in the Top Holdings list — that marks anything above 20% in a single stock, the level at which one announcement can move your whole portfolio.
- Sector Herfindahl Index adds up the square of each sector's share. 1.000 means everything is in one sector; below about 0.25 is considered reasonably spread, and above 0.25 turns red.
- Top-3 Stocks is the % of your portfolio value sitting in your three largest holdings; above 60% turns red.
- All shares use current market value (qty × live price), so they change as prices move during the trading day.
Acting on what you just read
This page only describes. Three pages in the menu are where you do something about it.
How — Suggestions turns the same concentration thresholds into plain prompts; Overview shows the sector and per-stock split behind them; Alerts can warn you when your one-day loss passes a rupee amount you choose.
- Remember that NEPSE has no automatic stop-loss order, so risk control here means position sizing and manual exits, not an order type.
Reading the numbers
- The gauge bands are fixed: under 4 is Low, 4 to under 7 is Medium, 7 and above is High. The same colours apply to the component bars — green under 4, amber 4 to 7, red above 7.
- Concentration Risk = your top 3 holdings' share of the portfolio ÷ 10, so a top-3 of 100 percent scores 10.
- Volatility Risk = annualised volatility ÷ 3, so a 30 percent swing scores 10. Market (Beta) Risk = beta × 5, so beta 2.0 scores 10. Drawdown Risk = the absolute max drawdown percentage ÷ 4, so a −40 percent fall scores 10. Every component is capped at 10.
- Sector Herfindahl Index adds up the square of each sector's share of your portfolio. 1.000 means everything sits in one sector; the figure turns red above 0.25.
- Top-3 Stocks is the percentage of portfolio value in your three largest holdings, and turns red above 60 percent. A single holding above 20 percent gets a warning marker.
- All concentration weights use current market value, that is quantity multiplied by the live price, so they move during the trading day.
- The Risk-Free Rate shown is the NRB 91-day treasury-bill yield, and it is the "safe" return Sharpe and Sortino compare you against.
- Beta near 1.0 means you move in step with NEPSE, 1.5 means you swing 50 percent harder, 0.5 means you are calmer than the market.
What it does not do
- Volatility, beta, Sharpe, Sortino, correlation, max drawdown and both VaR figures are read from a stored risk-metrics record. Until one has been computed for your account they show a dash, and the overall score shows 0.0 even though the concentration card below is already live.
- The bar shape under Max Drawdown is illustrative. It is drawn to your real drawdown depth to convey the scale, but it does not plot your actual day-by-day history — do not read individual bars as real days.
- VaR is not a maximum. A genuinely bad day can exceed it; that is exactly what the remaining 5 percent, or 1 percent, of days means.
- There is no combined view across portfolios, so if you deliberately split one strategy over two portfolios neither page shows your real total exposure.
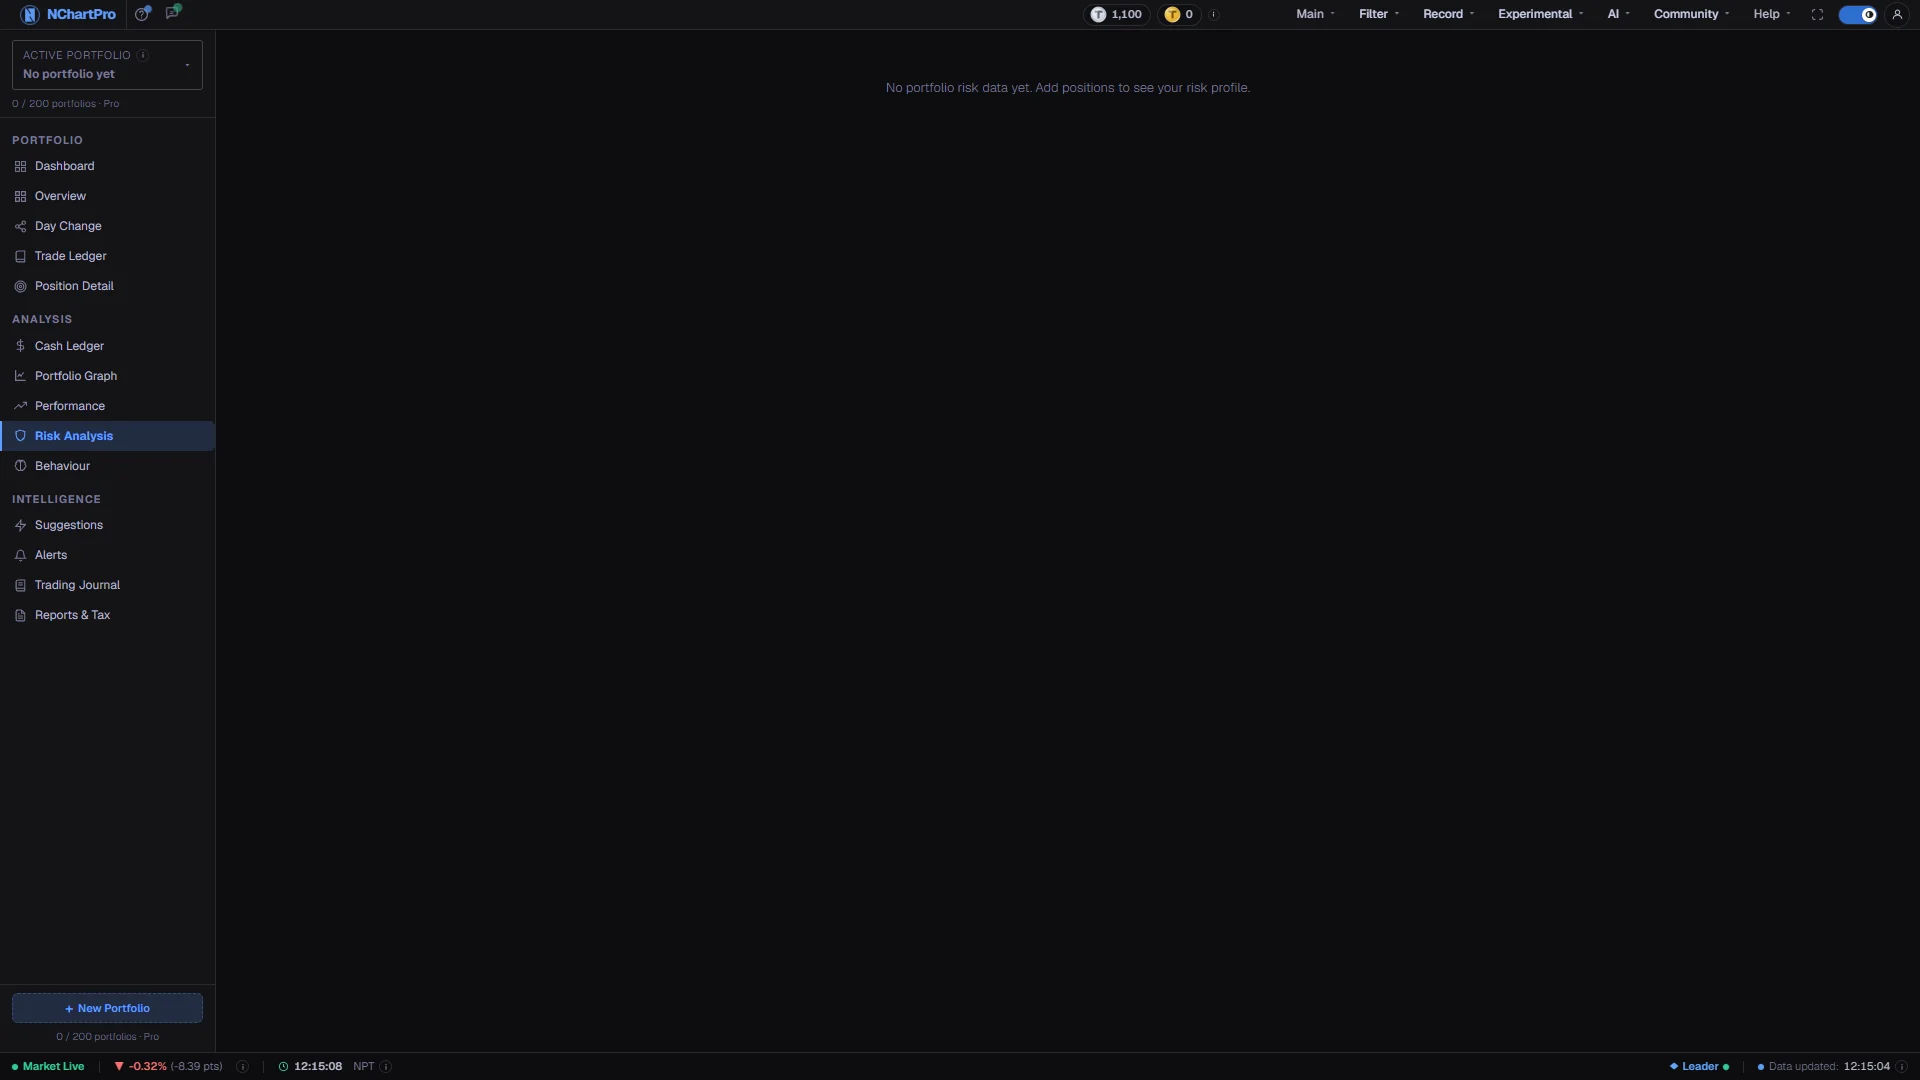
- The page reads "No portfolio risk data yet" until you hold positions, and the concentration figures only know about holdings you have actually entered.
- Nothing here is advice. It describes the portfolio you have; it does not tell you to trade.
Questions people ask
The score comes from the stored risk-metrics record, which has not been computed for your account yet. The concentration figures are calculated live, which is why one is populated and the other is not.
No. It means a bumpier ride. A portfolio of two hydropower stocks and a portfolio of twenty spread across sectors can earn the same return, but the first will swing far harder on the way there.
No, and not anywhere else either. NEPSE TMS has no automatic stop-loss order, so risk control in practice means position sizing and exiting manually. The Alerts page can notify you when a level is crossed.
No. The page describes; it does not instruct. The warning marker exists so the concentration is a choice you made knowingly rather than one you drifted into.