

Credits & Attribution
Almost nothing on this platform was invented here. The indicators were worked out over fifty years by named traders, analysts and researchers and published openly; we implemented them. This page names all of them, and is equally clear about the small part that is genuinely ours.
The two chart engines written for this platform — Karela, which draws the Chart page, and KNv2-LW, which draws the small charts on other pages, both in C++ and compiled to WebAssembly — follow conventions that TradingView established: how a drawing tool behaves once you place it, what belongs in a property sheet, how an indicator legend reads, and where a study lands. That debt is knowledge, not code. Neither engine contains any TradingView source.
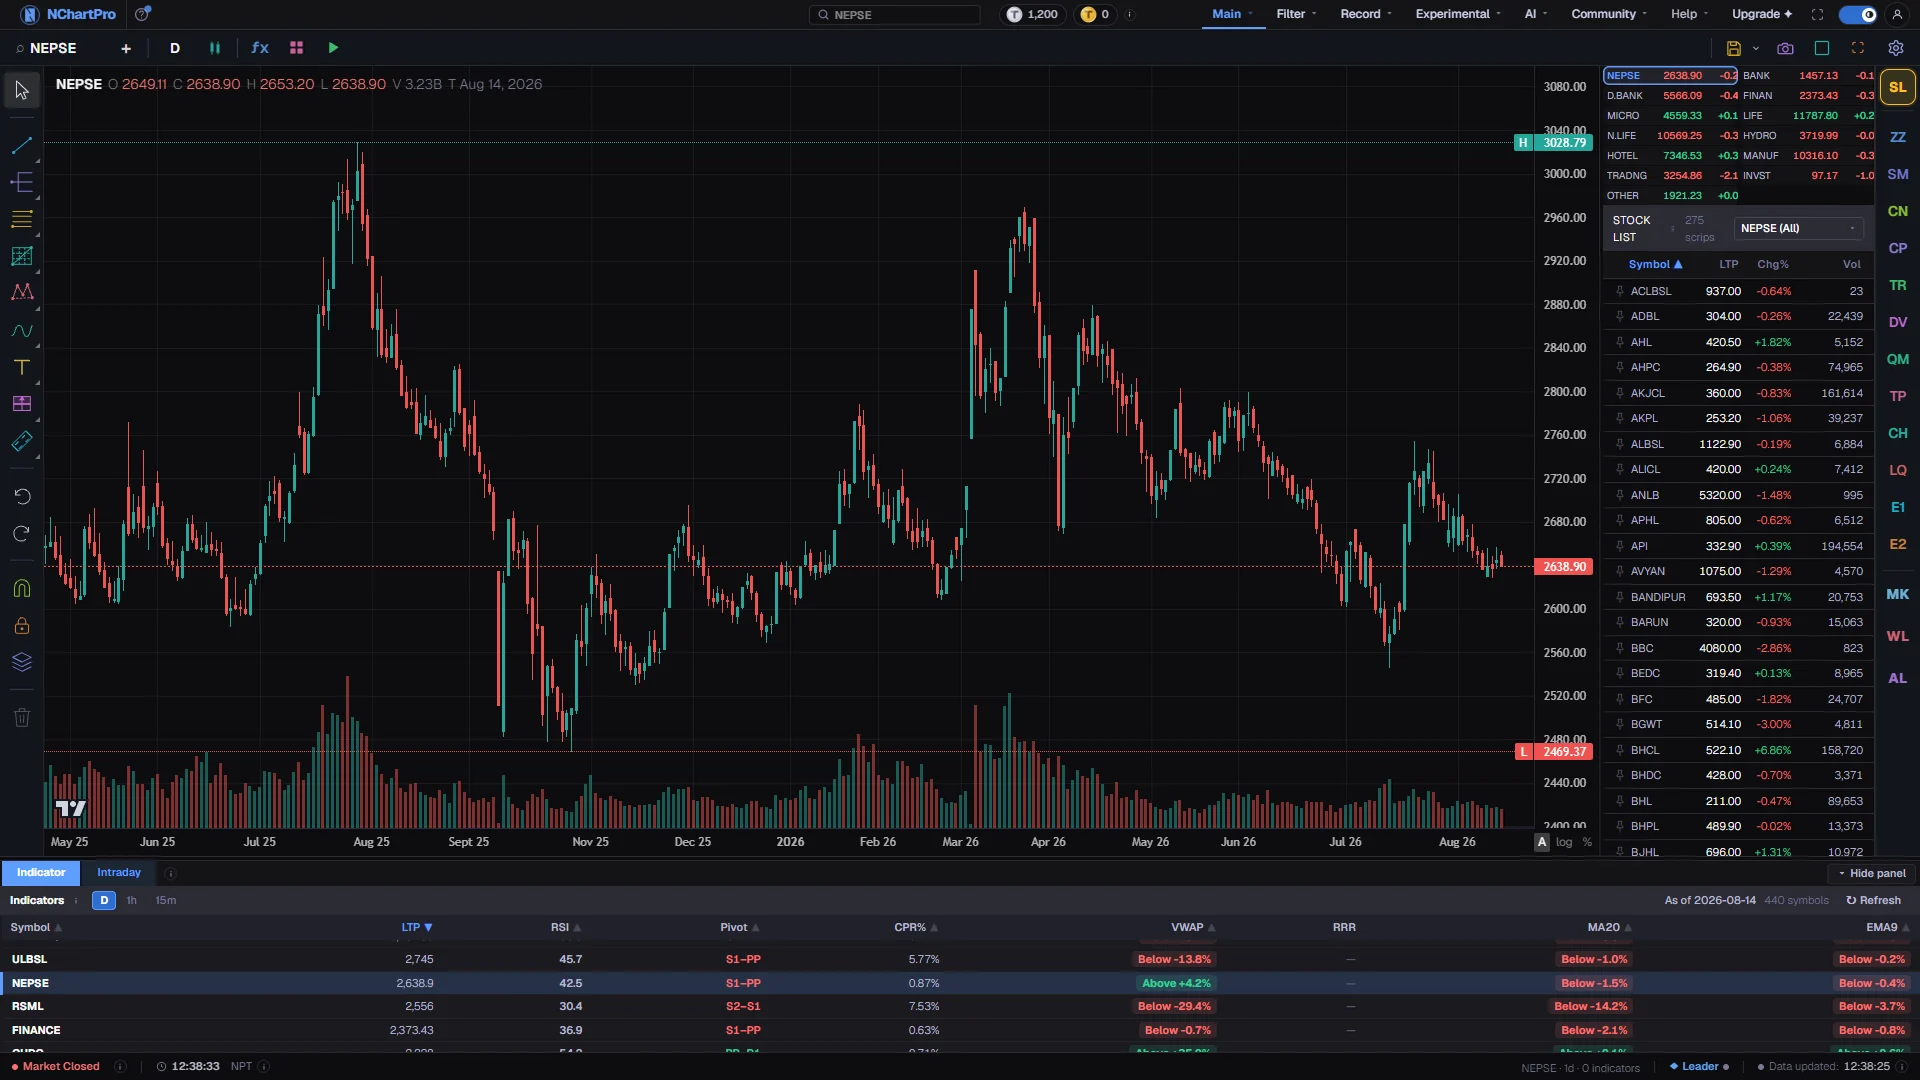
The screen below is drawn by Karela, so no TradingView code draws it. We do still ship TradingView’s open-source Lightweight Charts™ library, under the Apache License 2.0. It draws the small preview chart on the Script page and the chart on one experimental page, and those charts carry the TradingView mark in the corner. Its attribution notice, and how every licence here is honoured, are set out further down this page: tradingview.com
TradingView®, Lightweight Charts™ and the TradingView logo are trademarks of TradingView, Inc. NChart Pro is an independent product and is not affiliated with, sponsored by or endorsed by TradingView, Inc.
What this page is
Every indicator has an author. Somebody sat down, worked out that comparing the size of recent up-moves with recent down-moves would say something useful, published it, and the industry adopted it. This page lists all 276 grouped by that person, so you see whole bodies of work at once rather than one entry at a time.
The grouping is the point. Sorted by what an indicator measures, as the five category pages sort them, the Roofing Filter, the Super Smoother, the Laguerre RSI and the MESA Adaptive Moving Average are scattered across three pages. Sorted by author they are one block, and it becomes obvious that a whole family of what this chart can do came out of one engineer applying signal processing to price.
Every credit that can carry a citation now does. Under each author sits the actual reference — Wilder's 1978 book, the issue of Technical Analysis of Stocks & Commodities an indicator first appeared in, the Journal of Business paper behind a volatility estimator — with a link that goes straight to it. 183 of the 276 have one. The other 93 are the studies with no single originator, and they say so instead.
Two views of the same thing, because they answer different questions. By author shows you a body of work: every one of Ehlers' seventeen studies in one block, which the five category pages can never show because they sort by what an indicator measures. The A–Z index is the lookup — one row per indicator, with what we call it, what its inventor called it, who that was, and the reference. That second column matters more than it sounds: this chart draws ALMA as Gaussian Weighted Moving Average and the Hull as Lag-Reduced Moving Average, so without the published name a citation cannot be matched to the line on your screen.
The software credits split two ways, and the page is careful about which is which. Two of the five are shipped — their code runs in your browser. TradingView's Lightweight Charts™ draws the preview chart on the Script page and the chart on one experimental page; TA-Lib is compiled into the indicator engine your browser downloads and computes the classic indicators it already implements, such as RSI, MACD and ATR. The other three are libraries we do not ship at all: our own implementations were written against them and verified against their output, quirk for quirk, which is a real debt even though none of their code runs here.
Under those sits the licence accounting. Every open-source component here is used on its own licence's terms, and each licence asks for something specific — Apache 2.0 wants its notice kept and, in TradingView's case, an attribution and a link on a page you can actually reach; BSD 3-Clause wants its notice reproduced in the documentation; MIT and ISC want their permission notice carried along. The page lists what each one asks for and where it is met, so you can check it rather than take a compliance claim on trust.
A handful of studies genuinely have no author to name. Simple moving averages, price momentum, the price transforms, floor-trader pivots and the plain candle-anatomy ratios are older than the practice of attributing them, or are arithmetic too basic to be anybody's invention. Those are listed as classical rather than credited to whoever first wrote them down, because a confident wrong name is worse than an honest blank.
The block at the top is the original work, and it starts with the two chart engines. Karela and KNv2-LW are written from scratch in C++ and compiled to WebAssembly, so no outside charting library draws the Chart page — the conventions they follow came from studying TradingView, but none of their code did. Under them sit the KA indicators, the three forward range projections, the swing detection engine every detector is built on, the Smart Money Concepts detectors, the chart-pattern detection and scan, both Elliott Wave engines, the Dr Live analytics, every Floor Sheet filter and the broker analysis. Where one of those builds on somebody else's idea, the line under its heading says which part is theirs and which part is ours.
Why it helps you
- Searching an author is a genuinely good way to find your next indicator. If the Fisher Transform reads well on your charts, everything else John Ehlers published is one search away, and it is built on the same idea.
- It also tells you what an indicator was designed for. Wilder built the directional system for daily commodity charts in 1978; Bill Williams built the Alligator for a completely different style of trading. Knowing whose bench something came off explains a lot about when it works.
- The publication year is the quietly useful column. Anything from before the 1990s was designed to be calculated by hand or overnight on a mainframe, which is why the formulas are simple and the periods are round numbers.
- The academic entries deserve your attention. The volatility estimators — Parkinson, Garman-Klass, Rogers-Satchell, Yang-Zhang — come out of published finance research rather than trading floors, and they measure what they claim to measure.
- Sharpe, Sortino and Shannon are on this page for the same reason. The rolling risk measures on the Statistical and Cycle page are those researchers' work applied to a single price series.
- Seeing a study credited to a trading forum rather than to a paper is useful information about how much weight to put on it.
When to use it, and where to find it
- Read it once, early, to get a feel for who built the toolbox you are using. It makes the rest of the documentation read very differently.
- Come back when you want to go deeper on one approach. Find the author of an indicator that works for you, and read everything else under their heading.
- Open it if you are wondering whether a study is respectable. A named originator and a first publication is a much better sign than an anonymous script.
- It is the last entry in the left menu, under its own Credits & licences heading, which is where a legal notice is conventionally kept and where you would look for one.
- One credit is not on this page at all — it is on the chart. The TradingView mark in the corner of the Script page's preview chart, and of the chart on one experimental page, is the Lightweight Charts™ attribution, shown there because its licence asks for it to be where users are.
- The same credit appears on every row of the five indicator category pages, on the line above the description, and again at the top of each indicator's full-size preview.
- The search on any category page matches the inventor too, so typing "ehlers" on the Statistical and Cycle page filters it to his work without leaving that page.
Try it — a short walkthrough
- 1Find who made one you useType an indicator name into the search box. The block that survives is its author, with everything else they contributed listed beside it, and the publication it came from underneath.
- 2Read one author's whole setType a surname instead — Ehlers, Wilder, Chande, Williams. You get every indicator that person is behind in one list, with a reference for each separate thing they published.
- 3Look one up by name, either nameSwitch to A–Z index. One row per indicator: what we call it, what it was published as, who published it, and the reference. Search matches all four, so "Percent Range" and "Williams %R" both land on the same row.
- 4Go and read the originalClick the reference. Every link on this page was opened and checked before it was printed, and where a source has no reachable page the reference is still given — as text, with no link, rather than a plausible-looking dead one.
- 5Check the licencesRead The software. The Lightweight Charts™ attribution notice is printed there in full, the TA-Lib BSD 3-Clause notice opens underneath it, and How we meet the licences lists what each licence asks for beside where it is done.
- 6Go back to the study itselfTake a name from here to its category page and click its preview. The full-size picture carries the same credit above the description, plus a line-by-line account of what it draws.
Every part, up close
The Chart page — nearly everything reachable from this screen is credited on this page. Each part with a close-up of the real screen; the numbers match the dots on the picture.
The fx catalogue
Its 276 entries are credited here by author, and each also carries its inventor on its own row in the five indicator category pages.
Somebody worked this out
A line on your candles is arithmetic a specific person published, usually decades ago. This page is where that person is named.
Who invented these
Almost none of these 276 indicators are ours. They were worked out over fifty years by roughly 86 named traders, analysts and researchers, published in books and in magazines, and we implemented them. This page names every one of them, gives the publication each one came from so you can go and read it, and names the open-source libraries that either compute our numbers or were the specification we checked ours against.
The first Nepali charting engine written in C++ — designed and developed by Amrit Shrestha.
The whole application — its design and its development, front to back — is his work. Everything below this line was built here rather than licensed, ported or bought in: the engines that draw the chart, the detectors that mark it, and the analytics that rank the market. The rest of this page credits the people whose published work the indicators come from.
49 pieces of original work across 10 areas of the platform. Where a group builds on somebody else’s idea, the line under its heading says exactly which part is theirs and which part is ours.
Chart engines2
Written from scratch in C++ and compiled to WebAssembly so they run inside the browser. No charting library draws these pages.
Karela — the engine that draws the Chart page · KNv2-LW — the light engine that draws the small charts on other pages
Indicators6
Designed and built for this platform, and computed by their own engine rather than by the 276-entry catalogue.
Karela Band · CycleX · KA Canal · PAIT · TCR Long · TCR Short
Chart tools3
Forward projections drawn from the stock's own recent range.
Next Day Range · Next Week Range · Next Month Range
Swing detection1
The zigzag idea — reduce a price series to the reversals that clear a threshold — is classical and belongs to nobody. This depth-based swing engine, its rules for what counts as a pivot, and its code are ours, and it is the layer the Smart Money Concepts marks, the chart-pattern detection, the divergence scan and the liquidity levels are all built on. It is separate from the Zig Zag indicator on the fx menu, which is the classical percentage-deviation form.
Swing / zigzag detection engine
Smart Money Concepts marks9
The VOCABULARY is the SMC / ICT trading community's — order block, fair value gap, break of structure, liquidity sweep. Every detection algorithm behind these marks is ours: what counts as a valid block, how a gap is confirmed and invalidated, where a sweep begins and ends.
Order Blocks · Fair Value Gaps · Inverse FVG · Break of Structure · Change of Character · Liquidity · Liquidity Zones · Premium / Discount Zones · Swing Highs & Lows
Chart pattern detection2
The patterns themselves are classical charting — head and shoulders, triangles, flags, double tops. The detection algorithm and the scan that runs it across the whole market are ours.
Chart pattern detection · Pattern scan across all symbols
Elliott Wave engines2
The Wave Principle is Ralph Nelson Elliott's (1938), codified by Frost and Prechter. Both engines that count the waves here — their concept, their grammar and their implementation — are ours.
EW v1 — the wave-grammar engine · EW v2 — the ATR-zigzag engine
Dr Live6
The live-market analytics on that page: what qualifies as a spike, a breakout or a volatile stock, and how the live sheet is assembled.
Volume Spikes · Range Breakouts · Volatile · Volume Graph · Circuit Breaker · Live Floor Sheet
Floor Sheet filters15
Every filter under Floor Sheet — the measures, the thresholds and the ranking behind each one.
FS Meter · Daily Filter · Accumulation & Distribution · Stocks · Bulk Trade · Normal Volume · OTM · MKT · Pump N Dump · Volatile · Hot Stock · Sector Invest · Broker Invest · Broker Sector Invest · BS Volume
Broker analysis3
The whole broker section — how a broker's activity is measured, scored and ranked from the floor sheet.
Broker · Broker Invest · Broker Sector Invest
Credit owed, author not yet identified
E_RSI and RSI Amp. Adapted from an open-source TradingView community script. The underlying RSI is J. Welles Wilder Jr.'s; the amplitude idea and the smoothing arrangement came from that script, and only the C++ implementation here is ours. We are still identifying its author so they can be named properly.
Every indicator and its citation
276 indicators under 93 headings. 183 of them carry a full reference — the book, the journal or the magazine issue the method was first published in, with a link straight to it. The other 93 are the studies with no single originator to cite: a simple moving average, price momentum, floor-trader pivots, the plain candle ratios. Those say so, rather than naming a source we could not check.
Search a person, an indicator or a publication — the box filters whichever view you are in, and the A–Z index also matches the name an indicator was published under, which for a good many of them is not the name this chart draws it by.
Amrit Shrestha — NChart Pro
6 indicatorsCycleX · KA Canal · Karela Band · PAIT · TCR Long · TCR Short
Our own work is listed at the top of this page — it runs on separate engines and is not part of this catalogue.
John F. Ehlers
19 indicatorsCenter of Gravity · Correlation Trend Indicator · Cycle Indicator (Cyber Cycle) · Decycler (Ehlers Decycler) · Even Better Sinewave · Four-Stage Recursive Filter (Laguerre Filter) · Four-Stage RSI (Laguerre RSI) · Fractal Adaptive Moving Average · HT Dominant Cycle Period · HT Dominant Cycle Phase · HT Phasor Components · HT SineWave · HT Trend vs Cycle Mode · Instantaneous Trendline · MESA Adaptive Moving Average · Normalized Price Transform (Fisher Transform) · Relative Vigor Index · Roofing Filter · Super Smoother Filter
- Ehlers, John F. Rocket Science for Traders: Digital Signal Processing Applications. New York: John Wiley & Sons, 2001; and Cybernetic Analysis for Stocks and Futures. Hoboken, NJ: John Wiley & Sons, 2004.
- Ehlers, John F. "Using The Fisher Transform." Technical Analysis of Stocks & Commodities, V.20:11 (November 2002), pp. 40–42.
J. Welles Wilder Jr.
15 indicators· New Concepts in Technical Trading Systems, 1978Accumulative Swing Index · Average Directional Index · Average Directional Movement Rating · Average True Range · Directional Movement Index · Minus Directional Indicator · Minus Directional Movement · Normalized ATR · Parabolic SAR · Parabolic SAR (Extended) · Plus Directional Indicator · Plus Directional Movement · Relative Strength Index · Smoothed Moving Average (RMA) · True Range
Gauss & Legendre — least squares
8 indicators· Legendre 1805 · Gauss 1809Linear Regression Angle · Linear Regression Curve · Linear Regression Intercept · Linear Regression R-Squared · Linear Regression Slope · Regression Trend · Standard Deviation Channels · Time Series Forecast
Bill Williams
7 indicators· Trading Chaos, 1995Accelerator Oscillator · Alligator · Awesome Oscillator · Fractal · Fractal Chaos Bands · Gator Oscillator · Market Facilitation Index
Tushar Chande
7 indicatorsAroon · Aroon Oscillator · Forecast Oscillator · Intraday Momentum Index · Net Momentum Oscillator (Chande Momentum Oscillator (CMO)) · Qstick · Variable Index Dynamic Average
- Chande, Tushar S. "Adapting Moving Averages To Market Volatility." Technical Analysis of Stocks & Commodities, V.10:3 (March 1992), pp. 108–114.
- Chande, Tushar S., and Stanley Kroll. The New Technical Trader: Boost Your Profit by Plugging into the Latest Indicators. New York: John Wiley & Sons, 1994.
- Chande, Tushar S. "The Time Price Oscillator." Technical Analysis of Stocks & Commodities, V.13:9 (September 1995), pp. 369–374 — where Aroon is introduced.
Kevin Johnson
6 indicators· Pandas TA (PyPI)Binomial Weighted Moving Average (Pascal's Weighted Moving Average (PWMA)) · Fibonacci's Weighted Moving Average · MA Trend Agreement (Archer Moving Averages Trends (AMAT)) · Price Distance (Price Distance (PDIST)) · Sine Weighted Moving Average · Symmetric Weighted Moving Average
Gerald Appel
5 indicators· The MACD Trading Method, 1979Absolute Price Oscillator · MACD · MACD (Extended) · MACD (Fixed 12/26) · Percentage Price Oscillator
Marc Chaikin
5 indicators· A/D Line, Oscillator and Money Flow — 1970s–80sA/D Oscillator (Chaikin Oscillator) · Accumulation Money Flow (Chaikin Money Flow (CMF)) · Accumulation/Distribution Line · High-Low Range Volatility (Chaikin Volatility) · Money Flow Volume
Dr. Alexander Elder
4 indicators· Trading for a Living, 1993Bull/Bear Power (Elder-Ray Index) · Force Index · Impulse System (Elder Impulse System) · Volatility Thermometer (Elder's Market Thermometer)
Larry Williams
4 indicatorsPercent Range (Williams %R) · Range Accumulation/Distribution (Williams Accumulation/Distribution) · Synthetic VIX (Williams VIX Fix) · Ultimate Oscillator
- Williams, Larry R. How I Made One Million Dollars Last Year Trading Commodities. Carmel Valley, CA: Windsor Books, 1973 — where %R is introduced. Sources also date the method to 1966, so the year is approximate.
- Williams, Larry. "The Ultimate Oscillator." Technical Analysis of Stocks & Commodities, V.3:4 (July/August 1985), pp. 140–141.
- Williams, Larry. 'The VIX Fix.' Active Trader, December 2007. Author's own copy at ireallytrade.com.
- Williams, Larry R. Williams Accumulation/Distribution. No dated first publication traceable; documented by Incredible Charts.
Donald Dorsey
3 indicatorsInertia · Mass Index · Relative Volatility Index
- Dorsey, Donald. "Refining the Relative Volatility Index." Technical Analysis of Stocks & Commodities, V.13:9 (September 1995), pp. 388–391 — Inertia is introduced within this article.
- Dorsey, Donald. "The Mass Index." Technical Analysis of Stocks & Commodities, V.10:6 (June 1992), pp. 265–267.
- Dorsey, Donald. "The Relative Volatility Index." Technical Analysis of Stocks & Commodities, V.11:6 (June 1993), pp. 253–256.
John Bollinger
3 indicators· Bollinger on Bollinger Bands, 2001 · devised early 1980sBollinger %B · Bollinger Band Width · Bollinger Bands
Martin J. Pring
3 indicatorsKnow Sure Thing · Smoothed ROC · Special K
Perry J. Kaufman
3 indicators· Smarter Trading, 1995Adaptive Moving Average (Kaufman's Adaptive Moving Average (KAMA)) · AMA · Efficiency Ratio
Tushar Chande & Stanley Kroll
3 indicators· The New Technical Trader, 1994Smoothed Volatility Stop (Chande Kroll Stop (volatility form)) · Stochastic RSI · Volatility Stop (Chande Kroll Stop)
Colin Twiggs
2 indicatorsExponential Momentum (Twiggs Momentum) · True Range Money Flow (Twiggs Money Flow)
Frank A. Sortino & Robert van der Meer
2 indicators· Journal of Portfolio Management, 1991Downside Deviation · Rolling Downside-Adjusted Return (Sortino ratio, applied to a rolling window)
George C. Lane
2 indicators· Lane's Stochastics, S&C 1984 · method from the 1950sStochastic Fast · Stochastic Oscillator
Goichi Hosoda
2 indicators· developed 1930s–50s, published August 1969Ichimoku (Conversion + Base Line) · Ichimoku Cloud
J. Peter Steidlmayer
2 indicatorsMarket Profile · Volume Profile Visible Range
John F. Carter
2 indicators· Mastering the Trade, 2005Squeeze Pro · TTM Trend
Jon Andersen
2 indicators· S&C, September 1996Standard Error · Standard Error Bands
Joseph E. Granville
2 indicators· Granville's New Key to Stock Market Profits, 1963On Balance Volume · On Balance Volume Moving Average
LazyBear
2 indicatorsImpulse MACD · WaveTrend Oscillator
M.H. Pee
2 indicatorsTrend Intensity Index · Trend Trigger Factor
- Pee, M.H. "Trend Intensity Index." Technical Analysis of Stocks & Commodities, V.20:6 (June 2002), pp. 32–35.
- Pee, M.H. "Trend Trigger Factor." Technical Analysis of Stocks & Commodities, V.22:12 (December 2004), pp. 28–36. Distinct from the same author's "Trend Continuation Factor", V.20:3 (March 2002).
Mark B. Fisher; popularised by Frank Ochoa
2 indicators· The Logical Trader, 2002Central Pivot Range · Central Pivot Range (Fibonacci)
Patrick Mulloy
2 indicatorsDouble Exponential Moving Average · Triple Exponential Moving Average
Paul L. Dysart; refined by Norman Fosback
2 indicators· Stock Market Logic, 1976Negative Volume Index · Positive Volume Index
Stephen J. Klinger
2 indicators· S&C, December 1997Volume Force Oscillator (Klinger Volume Oscillator (KVO)) · Volume Force Signal (Klinger Volume Oscillator — signal line)
TradingView community script, adapted
2 indicators· based on J. Welles Wilder Jr.'s RSI, 1978 — original script author still being identifiedE_RSI · RSI Amp
Walid Khalil & David Steckler
2 indicatorsPrice Zone Oscillator · Volume Zone Oscillator
William Blau
2 indicatorsStochastic Momentum Index · True Strength Index
- Blau, William. The Stochastic Momentum Index, introduced in Technical Analysis of Stocks & Commodities, January 1993; collected in Blau, Momentum, Direction, and Divergence (Wiley, 1995).
- Blau, William. "Trading With The True Strength Index." Technical Analysis of Stocks & Commodities, V.10:5 (May 1992); collected in Blau, Momentum, Direction, and Divergence (Wiley, 1995).
Adam White
1 indicator· Futures magazine, August 1991Vertical Horizontal Filter
Alan Hull
1 indicator· alanhull.com, 2005Lag-Reduced Moving Average (Hull Moving Average (HMA))
Arnaud Legoux & Dimitrios Kouzis-Loukas
1 indicator· 24 November 2009Gaussian Weighted Moving Average (Arnaud Legoux Moving Average (ALMA))
Buff Pelz Dormeier
1 indicator· Investing with Volume Analysis, 2011Volume Price Confirmation Indicator
Charles C. Holt & Peter R. Winters
1 indicator· Holt-Winters smoothing, 1957 / 1960Trend-Adaptive Moving Average (Holt-Winters Moving Average (HWMA))
Chester W. Keltner; ATR form by Linda Bradford Raschke
1 indicator· How to Make Money in Commodities, 1960ATR Channels (Keltner Channels)
Chuck LeBeau
1 indicator· LeBeau's exit research, 1990sChandelier Exit
Claude E. Shannon
1 indicator· Bell System Technical Journal, 1948Entropy
Commonly attributed to Steve Nison
1 indicator· Beyond Candlesticks, 1994Disparity Index
Dan Valcu — modern Heikin-Ashi form
1 indicator· S&C, February 2004Smoothed Heikin Ashi
Daryl Guppy
1 indicator· Trend Trading · GuppyTraders.comMultiple Moving Average (Guppy Multiple Moving Average (GMMA))
David Bostian
1 indicator· no primary publication verifiedIntraday Intensity Index
Dean Malone
1 indicator· Compass FX, 2006Traders Dynamic Index
Dennis Yang & Qiang Zhang
1 indicator· Journal of Business, 2000Overnight-Adjusted Volatility (Yang–Zhang volatility estimator)
Don Worden
1 indicator· Worden Brothers, Inc.Time Segmented Volume
Donald Lambert
1 indicator· Commodities, October 1980Commodity Channel Index
Doug Schaff
1 indicator· FX Strategy, 1999Trend Cycle (Schaff Trend Cycle (STC))
E. Michael Poulos
1 indicator· S&C, February 1991Random Walk Index
E.W. Dreiss
1 indicator· Commodity Traders Consumer Report, 1992Choppiness Index
Edwin Sedgwick Coppock
1 indicator· Barron's, 1962Long-Term Momentum Curve (Coppock Curve)
Etienne Botes & Douglas Siepman
1 indicator· S&C, January 2010Vortex Indicator
Gene Quong & Avrum Soudack
1 indicator· S&C, March 1989Money Flow Index
Harold Edwin Hurst
1 indicator· rescaled-range analysis, 1951Rescaled Range Exponent (Hurst exponent)
Igor Livshin
1 indicator· S&C, August 2001Balance of Power
J.P. Morgan / Reuters
1 indicator· RiskMetrics Technical Document, 4th ed., 1996EWMA Volatility
Jack D. Schwager
1 indicator· Schwager on Futures: Technical Analysis, 1996Volatility Ratio
Jack K. Hutson
1 indicator· S&C, July/August 1983TRIX
John F. Carter; Pine version by LazyBear
1 indicator· Mastering the Trade, 2005Squeeze Momentum (TTM Squeeze)
John F. Ehlers & Ric Way
1 indicator· S&C, November 2010Zero-Lag EMA
John Herrick
1 indicator· no primary publication traceablePayoff Index (Simplified) (Herrick Payoff Index (HPI))
John R. McGinley
1 indicator· Journal of Technical Analysis, 1997Adaptive Dynamic Line (McGinley Dynamic)
Julius de Kempenaer (Relative Rotation Graphs), public approximation
1 indicator· RRG Research — the exact JdK formula is unpublished; this is an approximationRS-Ratio / RS-Momentum
Karl Pearson
1 indicator· Proceedings of the Royal Society, 1895Correlation Coefficient
Keith Fitschen
1 indicator· developed 1986, released 1993Aberration
L. C. G. Rogers & S. E. Satchell
1 indicator· Annals of Applied Probability, 1991Drift-Independent Volatility (Rogers–Satchell volatility estimator)
Larry Connors, Cesar Alvarez & Matt Radtke
1 indicator· Connors Research, 2014Composite RSI (ConnorsRSI)
Manning Stoller
1 indicator· Stoller Average Range Channels, mid-1980sSTARC Bands
Mark B. Garman & Michael J. Klass
1 indicator· Journal of Business, 1980OHLC Volatility (Garman–Klass volatility estimator)
Mark Johnson
1 indicator· no primary publication verifiedPretty Good Oscillator
Mel Widner
1 indicator· S&C, July 1997Rainbow Moving Average
Michael Parkinson
1 indicator· Journal of Business, 1980High-Low Volatility (Parkinson volatility estimator)
Norman Fosback
1 indicator· Stock Market Logic, 1976Cumulative Volume Index
Olivier Seban
1 indicator· no primary publication; date contestedSuperTrend
Peter G. Martin & Byron B. McCann
1 indicator· devised 1987; published 1989Ulcer Index
Price Headley
1 indicator· Big Trends in Trading, 2002Acceleration Bands
Richard Donchian
1 indicator· 1957 · four-week rule, 1960sPrice Channel (Donchian Channels)
Richard W. Arms Jr.
1 indicator· Volume Cycles in the Stock Market, 1983Ease of Movement
Robert Krausz, after W.D. Gann
1 indicator· S&C, February 1998HiLo Activator (Gann HiLo Activator)
Roger Altman
1 indicator· S&C, February 1993Relative Momentum Index
Roman Ignatov
1 indicator· QQE v1, 2006Quantitative Qualitative Estimation
Thomas R. DeMark
1 indicator· The New Science of Technical Analysis, 1994Directional Range Index (DeMarker (DeM))
Tim Tillson
1 indicator· S&C, January 1998T3 Moving Average
VWAP is standard practice; anchoring popularised by Brian Shannon
1 indicator· Maximum Trading Gains with Anchored VWAP, 2023Anchored VWAP
William F. Sharpe
1 indicator· Journal of Business, 1966Rolling Risk-Adjusted Return (Sharpe ratio, applied to a rolling window)
Classical technical analysis
56 indicatorsATR Trailing Stop · Average Price · Bar Range Expansion Index · Candle Body Ratio · Cumulative VWAP · Detrended Price Oscillator · Displaced Moving Average · Exponential Moving Average · Fast Divergence · Gap Analysis · MA Oscillator · MARSI · Median Price · Midpoint · Midprice · Momentum · Moving Average (selectable) · Moving Average Band · Moving Average Channel · Moving Average Compression · Moving Average Envelope · Moving Average Ribbon · Net Volume · Next Range · Percentage Bands · Percentage Volume Oscillator · PPMA · Price Volume Trend · Range Percentage · Rate of Change · Rate of Change Percentage · Rate of Change Ratio · Rate of Change Ratio (100 scale) · Rolling VWAP · RSI Double · Simple Moving Average · Trade Volume Index · TrendCycle · Triangular Moving Average · True Range Percent · Typical Price · Up/Down Volume Ratio · Upper/Lower Wick Ratio · Volatility Beta (Simplified) · Volume · Volume MA · Volume Oscillator · Volume Rate of Change · Volume Weighted Bollinger Bands · Volume Weighted Moving Average · VWAP Bands · Weighted Close · Weighted Moving Average · Zig Zag · ZigZag Swing · ZLMA
Classical statistics
15 indicatorsAutocorrelation (Lag-1) · Coefficient of Variation · Drawdown · Historical Volatility · Kurtosis · Log Return · Mean Absolute Deviation · Percent Return · Percentile Rank · Rolling Median · Rolling Quantile · Skewness · Standard Deviation · Variance · Z-Score
Trading community
9 indicatorsCumulative Volume Delta · Negative Volume Disparity · Positive Volume Disparity · Relative Volume · SSL Channel · Volume Delta (Approximation) · Volume Volatility · Volume-Price Confirmation · Volume-Weighted RSI
East Asian charting tradition
4 indicators· no single attributable originatorBias · BRAR · KDJ · Psychological Line
- A Greater-China extension of the stochastic oscillator — Lane, George C., “Lane’s Stochastics”, Technical Analysis of Stocks & Commodities, V.2:3 (May/June 1984) — adding a third derived J line whose author is not identifiable.
- The Japanese kairi (乖離率) or disparity measure, given a book-length Western treatment in Nison, Steve, Beyond Candlesticks: New Japanese Charting Techniques Revealed (John Wiley & Sons, 1994).
Floor-trader practice
2 indicatorsPivot Points (Classic) · Pivot Points Standard
Fractal-dimension literature
1 indicator· no single trading originatorFractal Dimension Index
The software
Draws the preview chart on the Script page and the chart on one experimental page. It no longer draws the Chart page. Shipped — its code runs in your browser, so this one is redistributed and its attribution notice is reproduced below in full. The TradingView mark in the corner of every chart it draws is part of that attribution, not a badge we chose to add.
TradingView, Inc. Lightweight Charts™ v5.2.1. Apache License 2.0.
Computes the classic indicators it already implements, such as RSI, MACD and ATR. Its code is linked into the engine your browser runs, so this one is redistributed and its notice is reproduced below in full.
Mario Fortier. TA-Lib: Technical Analysis Library. BSD 3-Clause License.
The specification our own implementations were written and verified against, quirk for quirk. Not shipped — no part of it runs here.
Anand Aravindan. technicalindicators v3.1.0. MIT License.
The reference for several families that have no other canonical published source — the weighted-average kernels, and the East Asian oscillators. Not shipped.
Kevin Johnson (twopirllc). Pandas TA: A Technical Analysis Library in Python 3. MIT License. Upstream repository withdrawn; PyPI is the surviving official record.
The reference rendering for WaveTrend, Impulse MACD and Squeeze Momentum. Re-implemented from the published formulas; nothing was copied.
LazyBear and others. Open-source Pine scripts published on TradingView.
Lightweight Charts™ attribution notice
“This license requires specifying TradingView as the product creator. You shall add the "attribution notice" from the NOTICE file and a link to https://www.tradingview.com/ to the page of your website or mobile application that is available to your users.” — the Lightweight Charts™ README
From the NOTICE file:
TradingView Lightweight Charts™
Copyright (c) 2025 TradingView, Inc. https://www.tradingview.com/
From the build running in your browser:
TradingView Lightweight Charts™ v5.2.1
Copyright (c) 2026 TradingView, Inc.
Licensed under Apache License 2.0 https://www.apache.org/licenses/LICENSE-2.0
Charting by TradingView — the same link the chart itself carries in its corner.
TA-Lib licence — the full BSD 3-Clause notice
Copyright (c) 1999-2025, Mario Fortier

Redistribution and use in source and binary forms, with or without modification, are permitted provided that the following conditions are met:

1. Redistributions of source code must retain the above copyright notice, this list of conditions and the following disclaimer.

2. Redistributions in binary form must reproduce the above copyright notice, this list of conditions and the following disclaimer in the documentation and/or other materials provided with the distribution.

3. Neither the name of the copyright holder nor the names of its contributors may be used to endorse or promote products derived from this software without specific prior written permission.

THIS SOFTWARE IS PROVIDED BY THE COPYRIGHT HOLDERS AND CONTRIBUTORS "AS IS" AND ANY EXPRESS OR IMPLIED WARRANTIES, INCLUDING, BUT NOT LIMITED TO, THE IMPLIED WARRANTIES OF MERCHANTABILITY AND FITNESS FOR A PARTICULAR PURPOSE ARE DISCLAIMED. IN NO EVENT SHALL THE COPYRIGHT HOLDER OR CONTRIBUTORS BE LIABLE FOR ANY DIRECT, INDIRECT, INCIDENTAL, SPECIAL, EXEMPLARY, OR CONSEQUENTIAL DAMAGES (INCLUDING, BUT NOT LIMITED TO, PROCUREMENT OF SUBSTITUTE GOODS OR SERVICES; LOSS OF USE, DATA, OR PROFITS; OR BUSINESS INTERRUPTION) HOWEVER CAUSED AND ON ANY THEORY OF LIABILITY, WHETHER IN CONTRACT, STRICT LIABILITY, OR TORT (INCLUDING NEGLIGENCE OR OTHERWISE) ARISING IN ANY WAY OUT OF THE USE OF THIS SOFTWARE, EVEN IF ADVISED OF THE POSSIBILITY OF SUCH DAMAGE.
How we meet the licences
Everything above is used under its own open-source licence, on that licence’s own terms. Each of them asks for something specific; this is what each one asks for and where it is done, so you can check rather than take our word for it.
Asks for. Keep the licence and copyright notice with the distribution, state any changes, and — TradingView's own additional condition — put the attribution notice and a link to tradingview.com on a page your users can reach.
Done. The notice is reproduced above and links to tradingview.com. The library is used unmodified, at the published version. Every chart it draws also carries TradingView's attribution mark, which their documentation names as a way to meet the link requirement; both are kept.
Asks for. Reproduce the copyright notice, the conditions and the disclaimer in the documentation of any binary distribution, and do not use the authors' names to endorse this product.
Done. The full notice is printed on this page — it is why this page cannot be removed. No TA-Lib contributor is named anywhere as endorsing anything here.
Asks for. Keep the copyright notice and the permission notice with the distribution.
Done. Listed by name and copyright holder under Third-party notices below. They are named here rather than left to the code because the production build MINIFIES the JavaScript it serves and the minifier drops comments, so the banner each library carries in its own source does not survive into the file your browser downloads — which is normal for a bundled web application, and is exactly why a page like this one has to exist.
Asks for. Nothing, in the licensing sense: none of their code is copied or shipped.
Done. Credited anyway. Reading somebody's published work to check your own against it is a real debt even when no licence compels the acknowledgement, and where the debt is more than a check — E_RSI and RSI Amp — it is listed above as an unresolved credit rather than quietly absorbed.
Third-party notices
The permissive-licence components that run in your browser, with the copyright line each one’s own licence carries. Their full licence texts are the standard MIT and ISC texts, available from each project.
- React · React DOM — Copyright (c) Meta Platforms, Inc. and affiliates. · MIT
- Next.js — Copyright (c) 2025 Vercel, Inc. · MIT
- D3 — Copyright 2010-2023 Mike Bostock · ISC
- Recharts — Copyright (c) 2015-present recharts · MIT
- Framer Motion — Copyright (c) 2024 Motion (motion.dev) B.V. · MIT
- html-to-image — Copyright (c) 2017-2026 W.Y. · MIT
- react-gauge-component — Copyright (c) 2023 antoniolago · MIT
- Monaco Editor — Copyright (c) 2016 - present Microsoft Corporation · MIT
- quickjs-emscripten · QuickJS — quickjs-emscripten copyright (c) 2019-2024 Jake Teton-Landis. Embeds QuickJS, copyright (c) 2017-2021 Fabrice Bellard and Charlie Gordon. · MIT
- tslib — Copyright (c) Microsoft Corporation. Incorporated in part into Lightweight Charts™. · BSD Zero Clause (0BSD)
Where an indicator has no single established originator it is listed under Classical technical analysis, Trading community or the charting tradition it comes from, rather than being credited to a name we could not verify.
Trademarks
All product names, logos, brands, trademarks and registered trademarks named on this page are the property of their respective owners. They are used here for identification purposes only, and their use does not imply any affiliation with, sponsorship by or endorsement from their owners.
TradingView®, Lightweight Charts™ and the TradingView logo are trademarks of TradingView, Inc. NChart Pro is an independent product and is not affiliated with, sponsored by or endorsed by TradingView, Inc.
“Market Profile” is a registered trademark associated with the Chicago Board of Trade; our volume-at-price study follows the method, and is not an official Market Profile product.
What it does not do
- A link is a pointer, not a paywall pass. Several of these references are books you have to buy and magazine articles the publisher sells; the link goes to the catalogue entry or the publisher's page for the issue, which is enough to find it in a library, not enough to read it for free.
- Where no primary source could be verified, the reference says so in as many words rather than quietly citing the best-looking secondary account as though it were the original. SuperTrend, the Pretty Good Oscillator, the Herrick Payoff Index and the ATR form of the Keltner Channel are all in that position, and each one's citation admits it.
- A first publication date is not always a first invention date. Several of these circulated on trading floors for years before anyone wrote them up, and the credit here is to whoever published, which is the only thing that can be checked.
- Where a study has several plausible originators it is credited to the one the published record supports, with the alternative left out rather than hedged. A few genuinely contested ones say "commonly attributed to", and that wording is deliberate.
- The classical and trading community headings are honest admissions, not placeholders. Nobody knows who first drew a simple moving average, and we would rather say so than pick a name.
- One credit is openly unfinished. E_RSI and RSI Amp were adapted from an open-source TradingView script and we have not yet identified its author, so the page says so instead of either claiming the work or quietly leaving it unlabelled.
- The page opens by calling this the first Nepali charting engine written in C++. That claim is the author speaking about his own work — there is no register of such things to check it against, and nothing in this documentation verifies it. Everything else on the page is checkable against a publication.
- The candle-pattern detectors are not in the original-work block. Those shapes and their detection are long-established Japanese candlestick analysis, and only the marks listed at the top of this page are ours.
Questions people ask
Several indicators are drawn under a plain descriptive name rather than their inventor's — ALMA appears as Gaussian Weighted Moving Average, the Hull as Lag-Reduced Moving Average, Williams %R as Percent Range. That keeps the legend readable for someone who has never traded. This page is where the names those legends drop are given back.
The block at the top of the page, and nothing else. Both chart engines — Karela and KNv2-LW — written in C++ and compiled to WebAssembly. The KA indicators: Karela Band, CycleX, KA Canal, PAIT and the two TCR tracks. The three forward range projections. The swing detection engine — the zigzag every detector reads — and, on top of it, the Smart Money Concepts detectors, the chart-pattern detection and its market-wide scan, and both Elliott Wave engines. The Dr Live analytics, every Floor Sheet filter, and the broker analysis. Everything else on the chart is somebody else's idea, implemented by us.
Correct, and the page says so. Order block, fair value gap, break of structure and liquidity sweep are the SMC and ICT trading community's vocabulary, not ours. What is ours is every detection algorithm behind those marks — what counts as a valid block, how a gap is confirmed and invalidated, where a sweep begins and ends. The same distinction applies to Elliott Wave, where the Wave Principle is R. N. Elliott's and both counting engines are ours, and to the chart patterns, which are classical shapes found by our own detector.
Two different things that share a name. The Zig Zag on the fx menu is the classical percentage-deviation filter — draw a line to every reversal bigger than N per cent — which nobody can be shown to have invented, so it is credited as classical like any other piece of common arithmetic. The swing detection listed in the original-work block is a different engine, with its own rules for what counts as a pivot and its own depth control, and it is not on the indicator menu at all: it is the layer underneath, and the Smart Money Concepts marks, the chart-pattern detection, the divergence scan and the liquidity levels all read their swings from it.
Both, split down the middle of the catalogue. TA-Lib computes the classics it already implements, such as RSI, MACD and ATR. The rest are our own C++, because TA-Lib has no equivalent. That split is about whose code runs, not about whose idea it was; the credit line always names the inventor.
Because no single originator can be established. A simple moving average, price momentum, floor-trader pivot levels and the plain candle ratios were all in common use before anyone thought to sign them. Inventing a name to fill the column would be worse than the blank.
No. Every name on this page is used to identify who invented or built what — nothing more. None of these people or companies has reviewed, endorsed or is connected with this product, and the TA-Lib licence specifically forbids us implying otherwise. TradingView®, Lightweight Charts™ and the TradingView logo are their trademarks; all other product names and marks named here belong to their respective owners. Using their open-source library on its published licence terms, and saying so, is not a relationship.
The Chart page is ours. It is drawn by Karela, our own C++ engine, and carries the KARELA mark. The small charts on other pages, such as Dashboard and Comparison, are drawn by KNv2-LW, which is also ours. TradingView's Lightweight Charts™, an open-source library we ship under Apache 2.0, draws only the preview chart on the Script page and the chart on one experimental page — those carry the TradingView mark in their corner.
It is there because the licence asks for it, and no. Lightweight Charts™ is free under Apache 2.0 on the condition that TradingView is named as the creator, with the attribution notice and a link to tradingview.com where users can see them. The mark in the corner of those charts is that link, and it is switched on deliberately in the chart's own configuration. Turning it off would put the product out of compliance with the licence it is using, which is not a trade worth making for a few pixels.
Yes, and "How we meet the licences" on this page is the working. Each component here is listed with what its licence asks for and where that is done — the Lightweight Charts™ attribution notice and link, the TA-Lib BSD notice reproduced in full, the MIT and ISC permission notices carried in the bundles they come from. Nothing here is used outside its licence, nothing is modified and passed off as unmodified, and where we owe a credit no licence compels — the reference implementations, and one script whose author we have not yet identified — it is given anyway.